
Debug Console in KM
Watch the tutorial
Debug Console in KM
The Debug Console in the KM dashboard is a tool that lets you simulate user interactions, capture responses from the KM agent in the virtual assistant, and thoroughly debug queries. It provides KM admins with clear insights into how the AI pipeline processes requests by showing:
- Which user received which response from the KM agent.
- The underlying reasons behind the responses generated by the AI pipeline. This can be concluded from the associated metadata of a response.
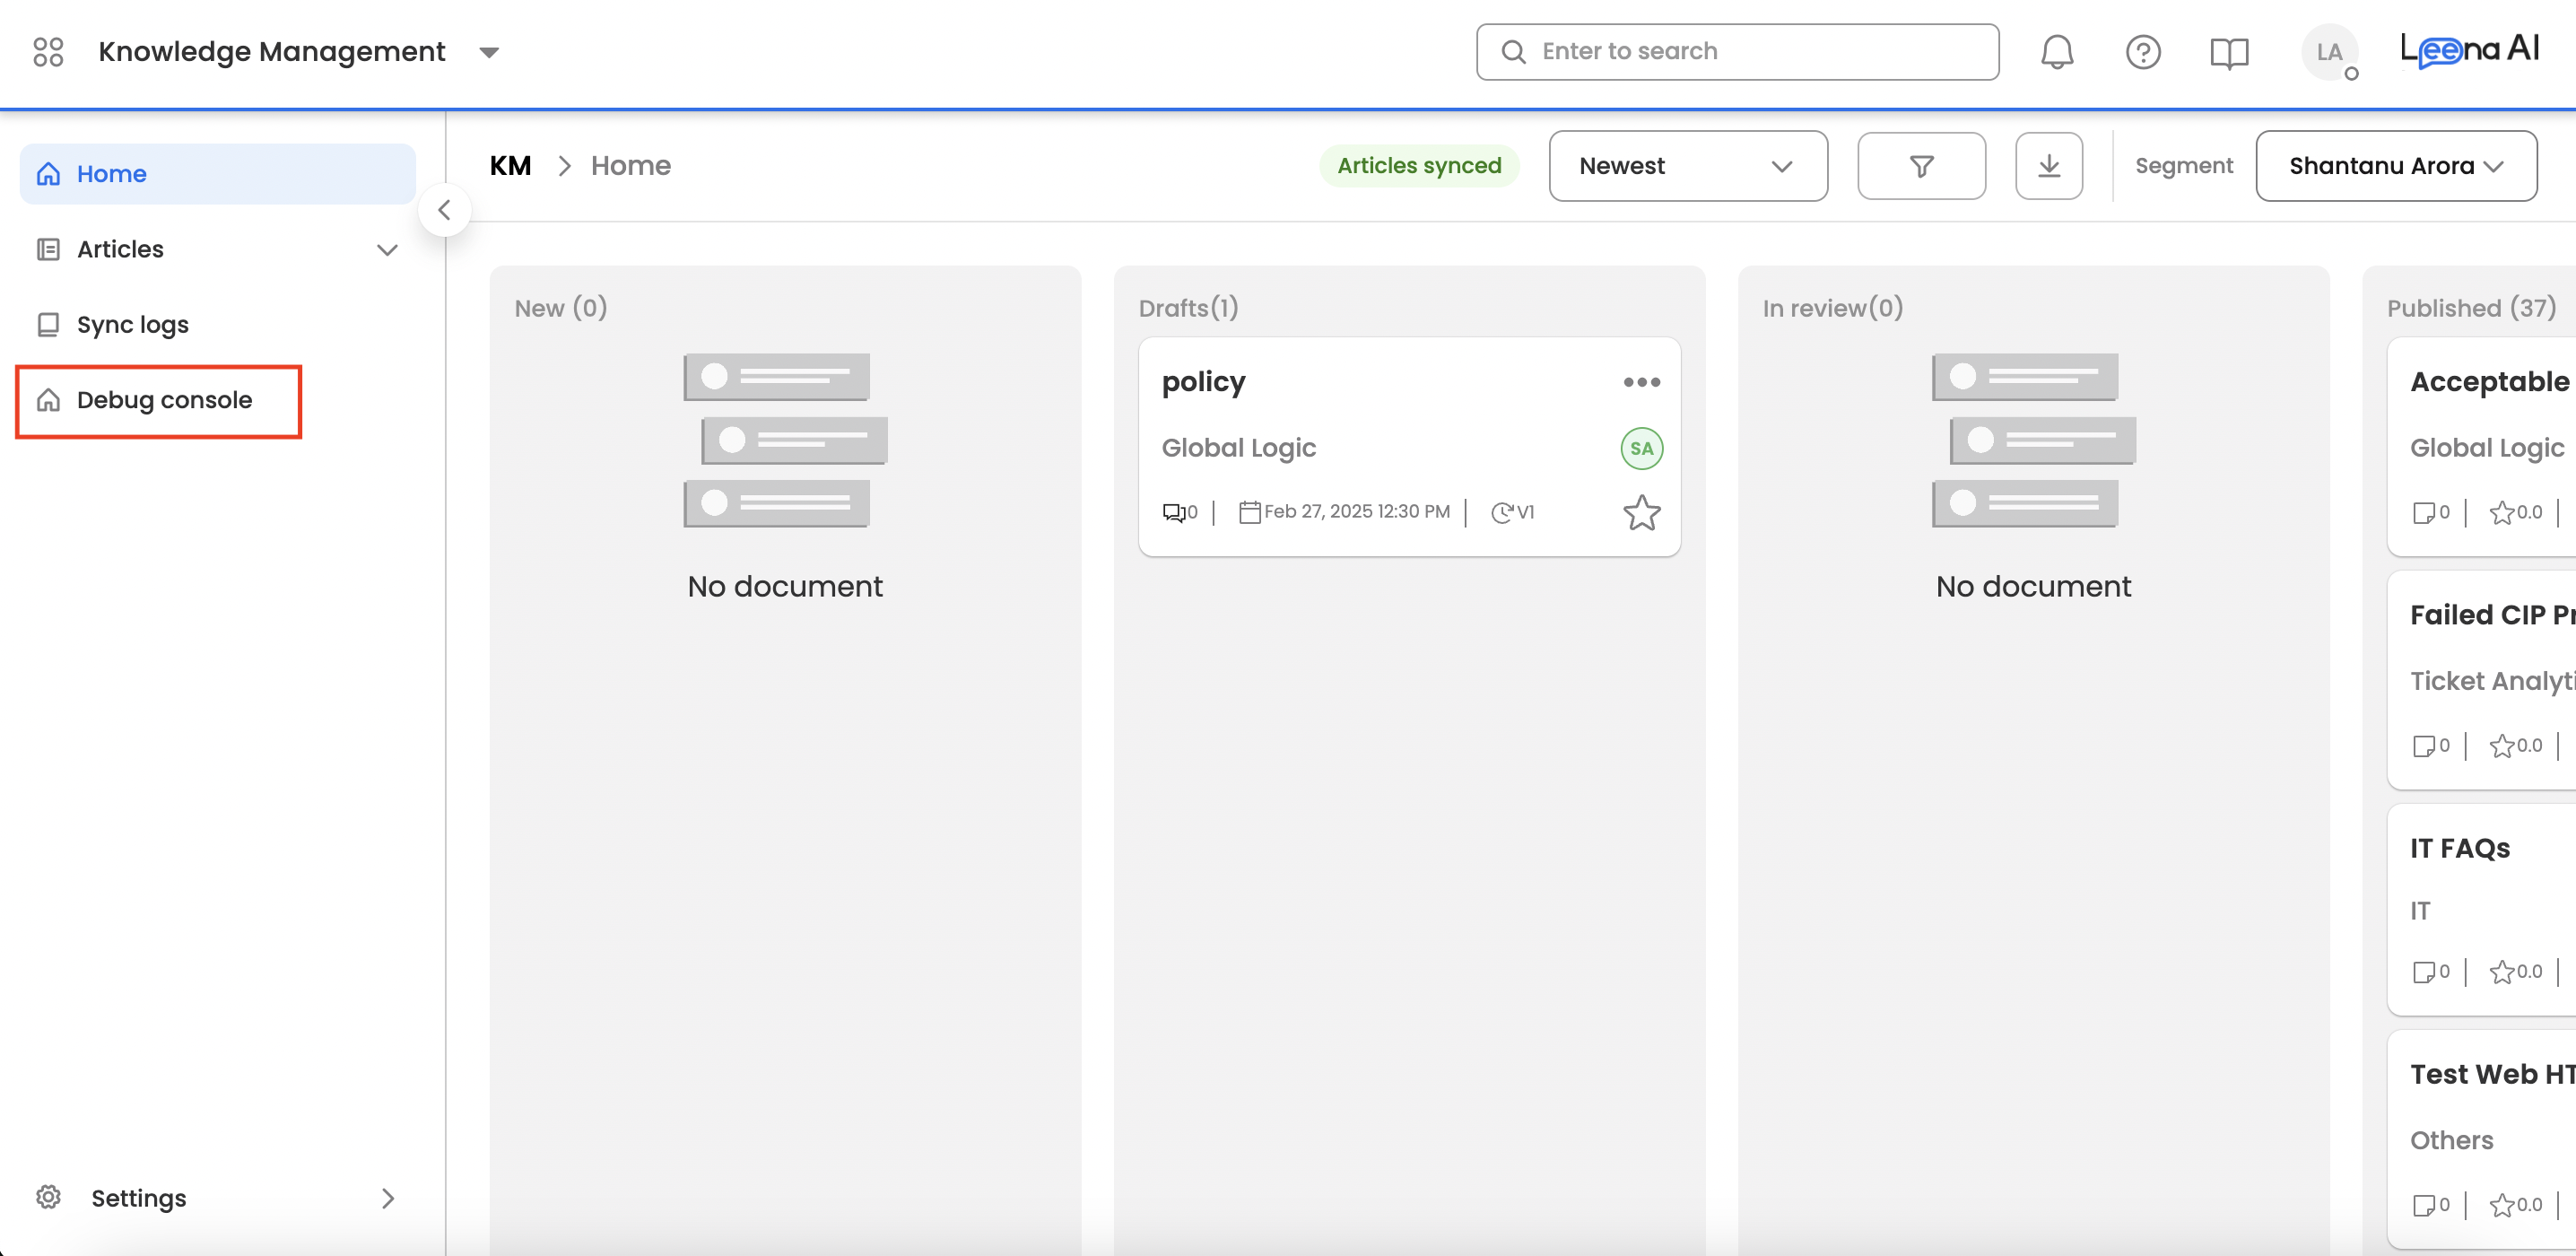
How to Navigate to Debug Console
The Debug console can be navigated from the KM Home page.
Who Can Access Debug Console
The Debug console can only be accessed by "KM admins".
How to Use Debug Console
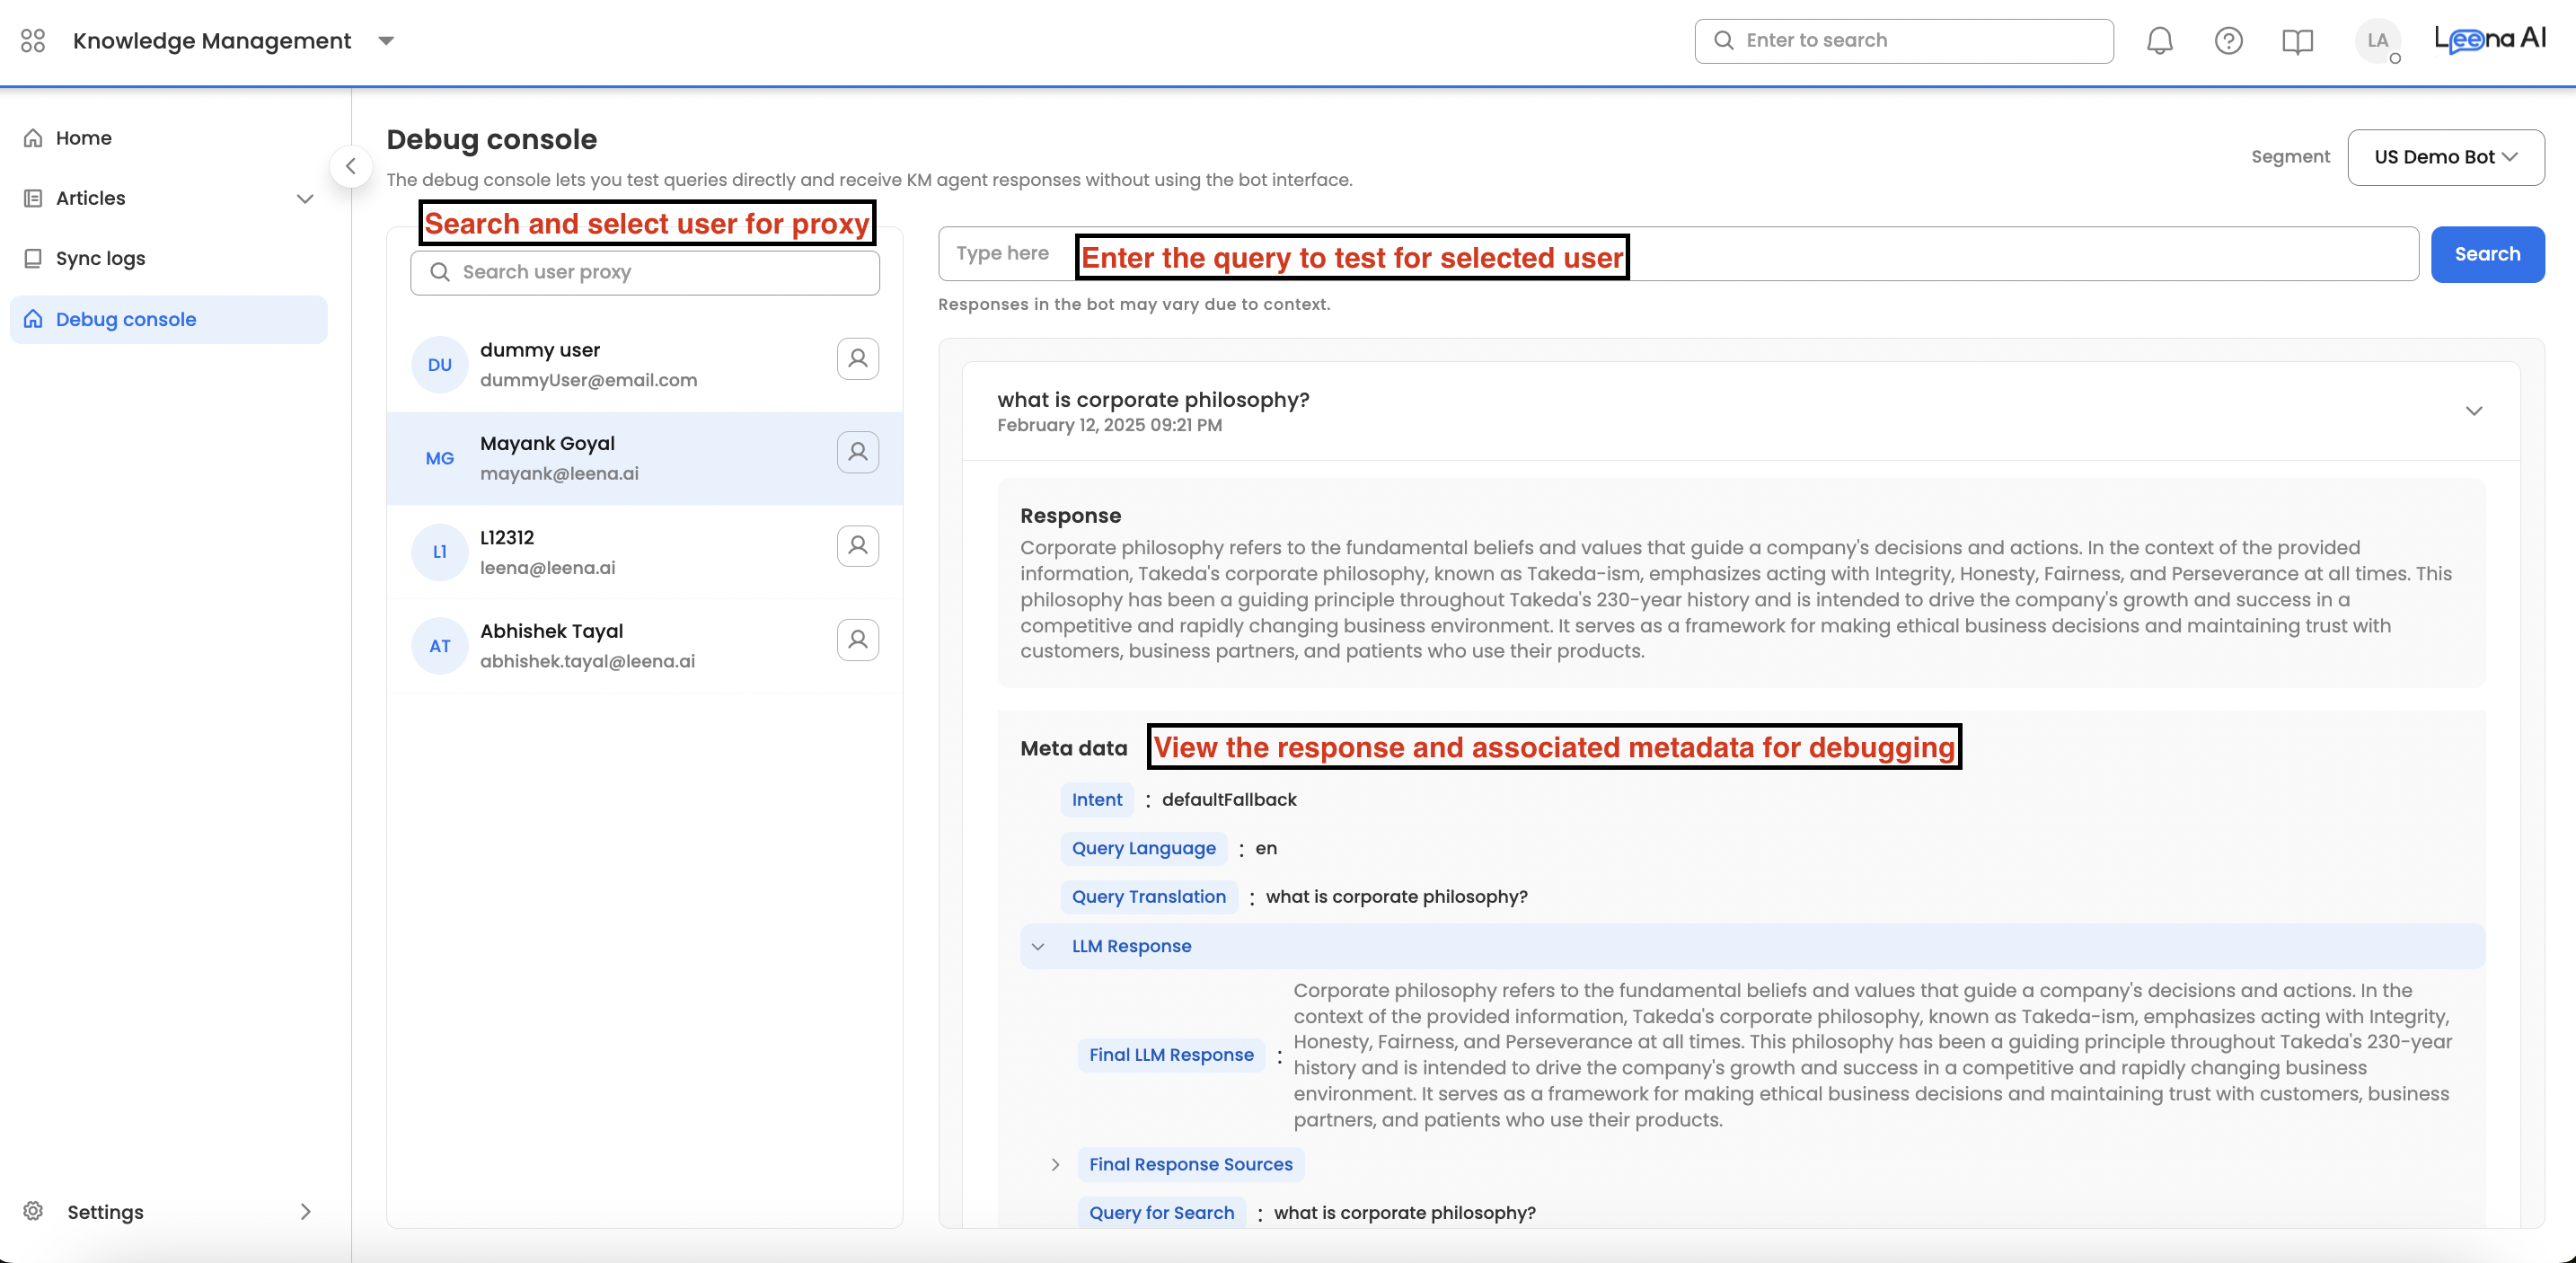
- Select a Bot User: After accessing the Debug Console, KM admins must choose a bot user on which to run their query. You also have the option to use a dummy user that bypasses audience filtering.
- Enter and Execute Your Query: Once the user is selected, type your query into the text box and click the search button.
- Review the Response and Metadata: The console displays the generated response along with detailed metadata, which helps diagnose why a particular response was produced. Refer to the section below for explanations of each metadata element.
Note: Please refer to this document for a better understanding of debug logs - Lifecycle of user query in KM
Metadata Explanations
- Intent: This is the predicted FAQ. "Default fallback" means that no intent was predicted for the given user query.
- Query Language: This is the language in which the user asked the query.
- Query Translation: For queries submitted in languages other than English, this field displays the translated version in English.
- LLM Response: This field is divided into subfields that display metadata related to the LLM's response.
- Final LLM Response: This is the final response given by the LLM.
- Final Response Sources: These are the source articles displayed alongside the LLM response, providing context and supporting information to the bot user. This further includes: article id, article title, article preview along with the highlighted section from which the response was given, article audience, and article type.
- Query for Search: This is the user query which is sent to the LLM.
- Search Types Enabled: Leena AI supports the following search types: document search, website search, and csv search. This field denotes which search type is enabled for the bot. (Please refer here for more information on different search types).
- Chosen Search Type: The LLM selects a search type that serves as the basis for constructing the final user response.
- Time Taken: This denotes the time taken by different search pipelines to give the response. This is in "seconds".
- Note: After all search pipelines give their responses, a different LLM selects which response is more accurate for the given user query.
- Document Search Debug: This field is divided into subfields that display metadata related to the document search.
- Query Debug: This displays the user query, the query used for document search, and the query sent to the LLM.
- Translation Debug: This can be used for non-english user queries to check how the user query is translated to English.
- Search sections passed to LLM: The document search pipeline extracts the most relevant sections from articles that address the user's query. These sections are then provided to the LLM, which crafts a user-friendly response based on the extracted data. Users can click on each section to view the article details.
- Personalised Response Debug: This section outlines the personalization feature available for bots. Personalization involves generating tailored responses from an article based on user-specific parameters.
- For example, in a leave policy where leave entitlements vary by employee band, if a user asks, "What is my leave allotment?" the system determines the user’s grade and provides the corresponding response from the article.
- LLM Response for Query: This denotes the response framed by the search pipeline.
- Structured CSV Search Debug --> tables passed to generate SQL query: This denotes the tables which are sent to the LLM to generate a SQL query. (For information refer this).
- Structured CSV Search Debug --> Generated SQL query: This denotes the SQL query generated by the LLM based on the "user query".
- Structured CSV Search Debug --> Fetched SQL query results: This denotes the results fetched from SQL tables for the user query.
- Structured CSV Search Debug --> LLM response for query: The SQL results are passed to the LLM to generate the final response.
- Unstructured CSV Search Debug --> Tables passed to LLM: This denotes the tables directly passed to the LLM to generate a response for the user query. No SQL was generated as these were unstructured tables.
- Website Search Debug: This field is divided into subfields that display metadata related to the website search:
- Website page header
- Website page sectional content
- Website page url
How Long Will Debug Logs Be Stored?
For each KM admin user, we will store their entire search history of debug logs.