Health Dashboard in Knowledge Management
Watch the tutorial
Product Documentation: Knowledge Health Dashboard (High-Level Overview)
Summary
This document outlines the Knowledge Health Dashboard, a centralised command centre for monitoring the knowledge base. The primary goal is to empower administrators with actionable, real-time insights, shifting content management from a reactive to a proactive process. By surfacing key metrics on content relevance, system integrity, and AI performance, the dashboard aims to improve quality, increase operational efficiency, and ensure a reliable user experience.
1. Introduction
The Knowledge Health Dashboard is a command centre for administrators and content managers. It provides a quick, visual snapshot of the knowledge base's overall health, transforming system maintenance from a reactive task to a proactive strategy. The goal is to ensure all content is accurate, accessible, and effective.
Drill-downs from most modules lead to a detailed list of the affected articles. From that list, you can navigate directly to the original article and its metadata to take action.
2. Accessing the Dashboard
The Knowledge Health Dashboard can be accessed from the main navigation panel on the left side of the screen. It is located directly below the Home icon.
The dashboard shall only be accessible to administrators within Knowledge Management.
3. Dashboard Modules: At a Glance
Each module on the dashboard targets a key area of knowledge base health, providing metrics and direct pathways to resolve issues.
Content Relevance & Quality
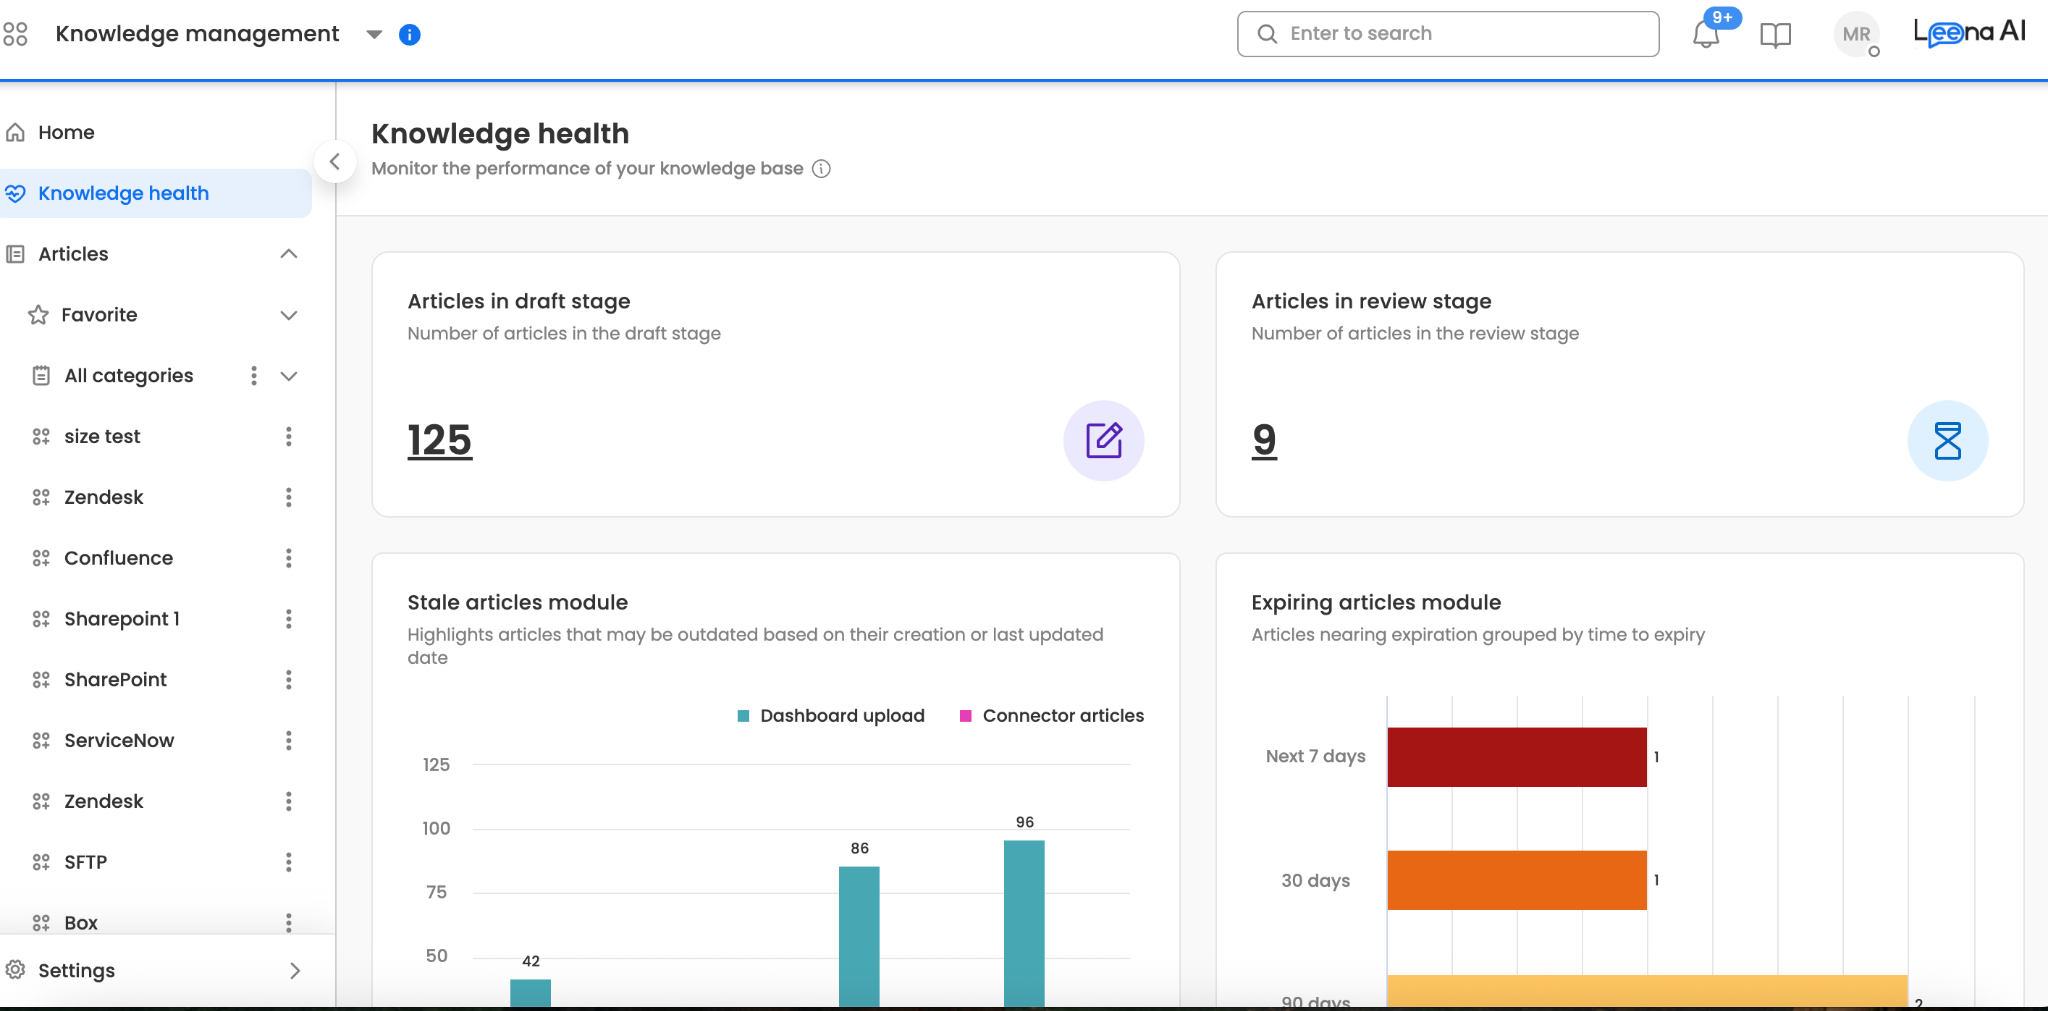
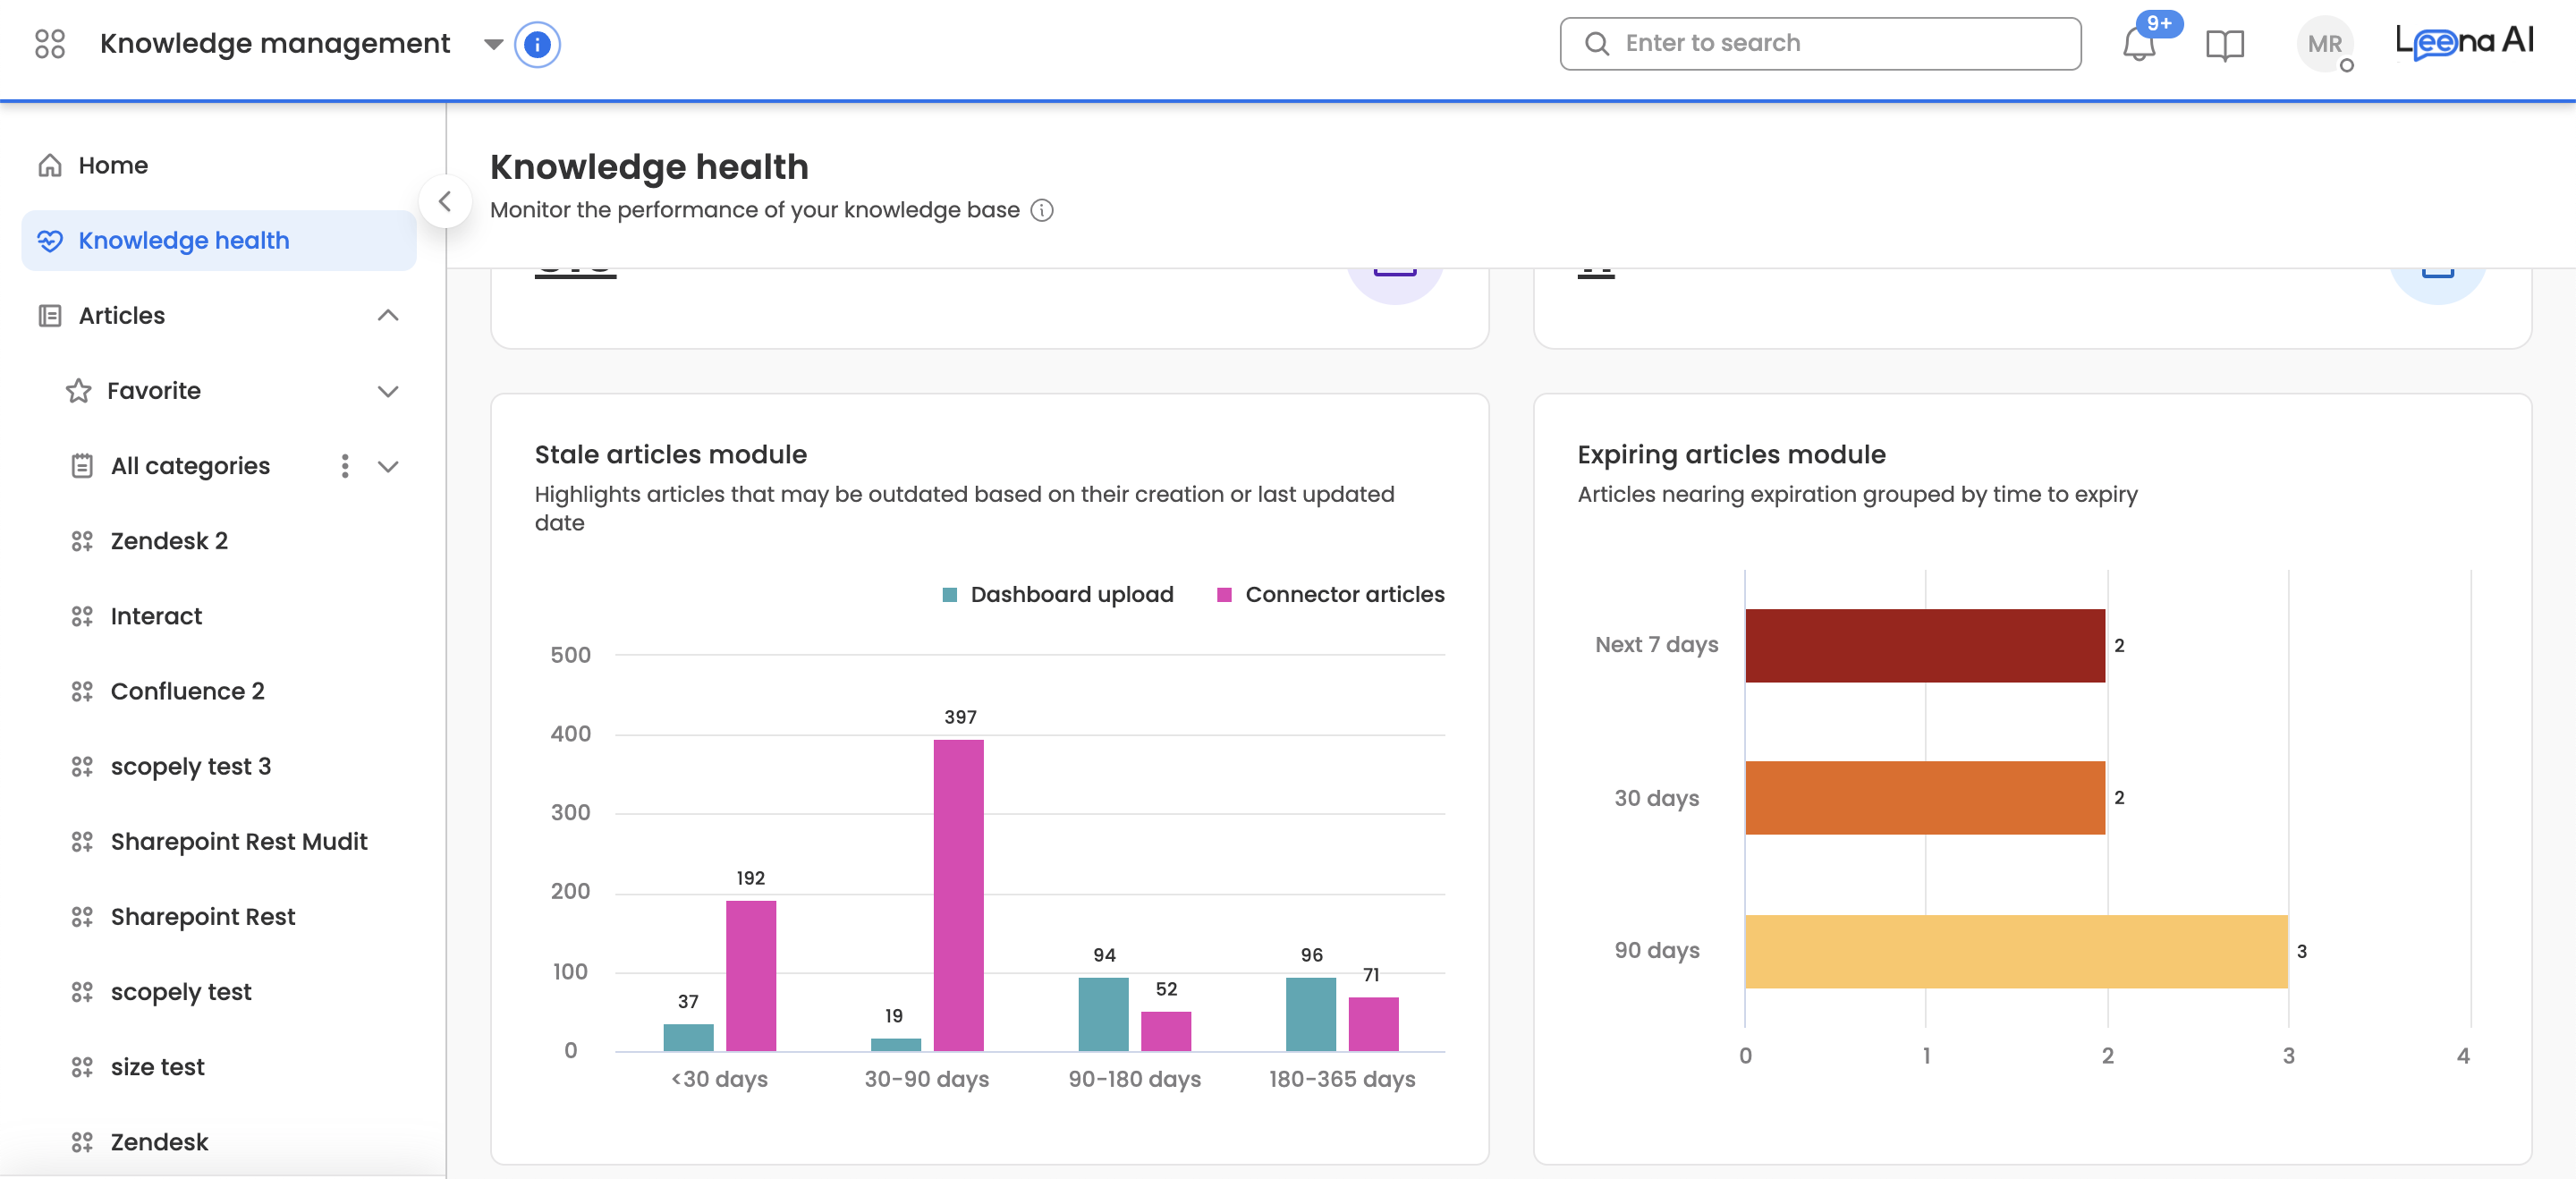
- Stale Articles: This module tracks content aging to combat outdated information. It flags articles that haven't been updated recently, allowing managers to quickly review, refresh, or archive them to keep the knowledge base current and trustworthy.
- Expiring Articles: This enforces content lifecycle policies by tracking time-sensitive articles. It gives proactive alerts for content nearing its review date, ensuring information is either validated or retired appropriately.
System Integrity & Operations
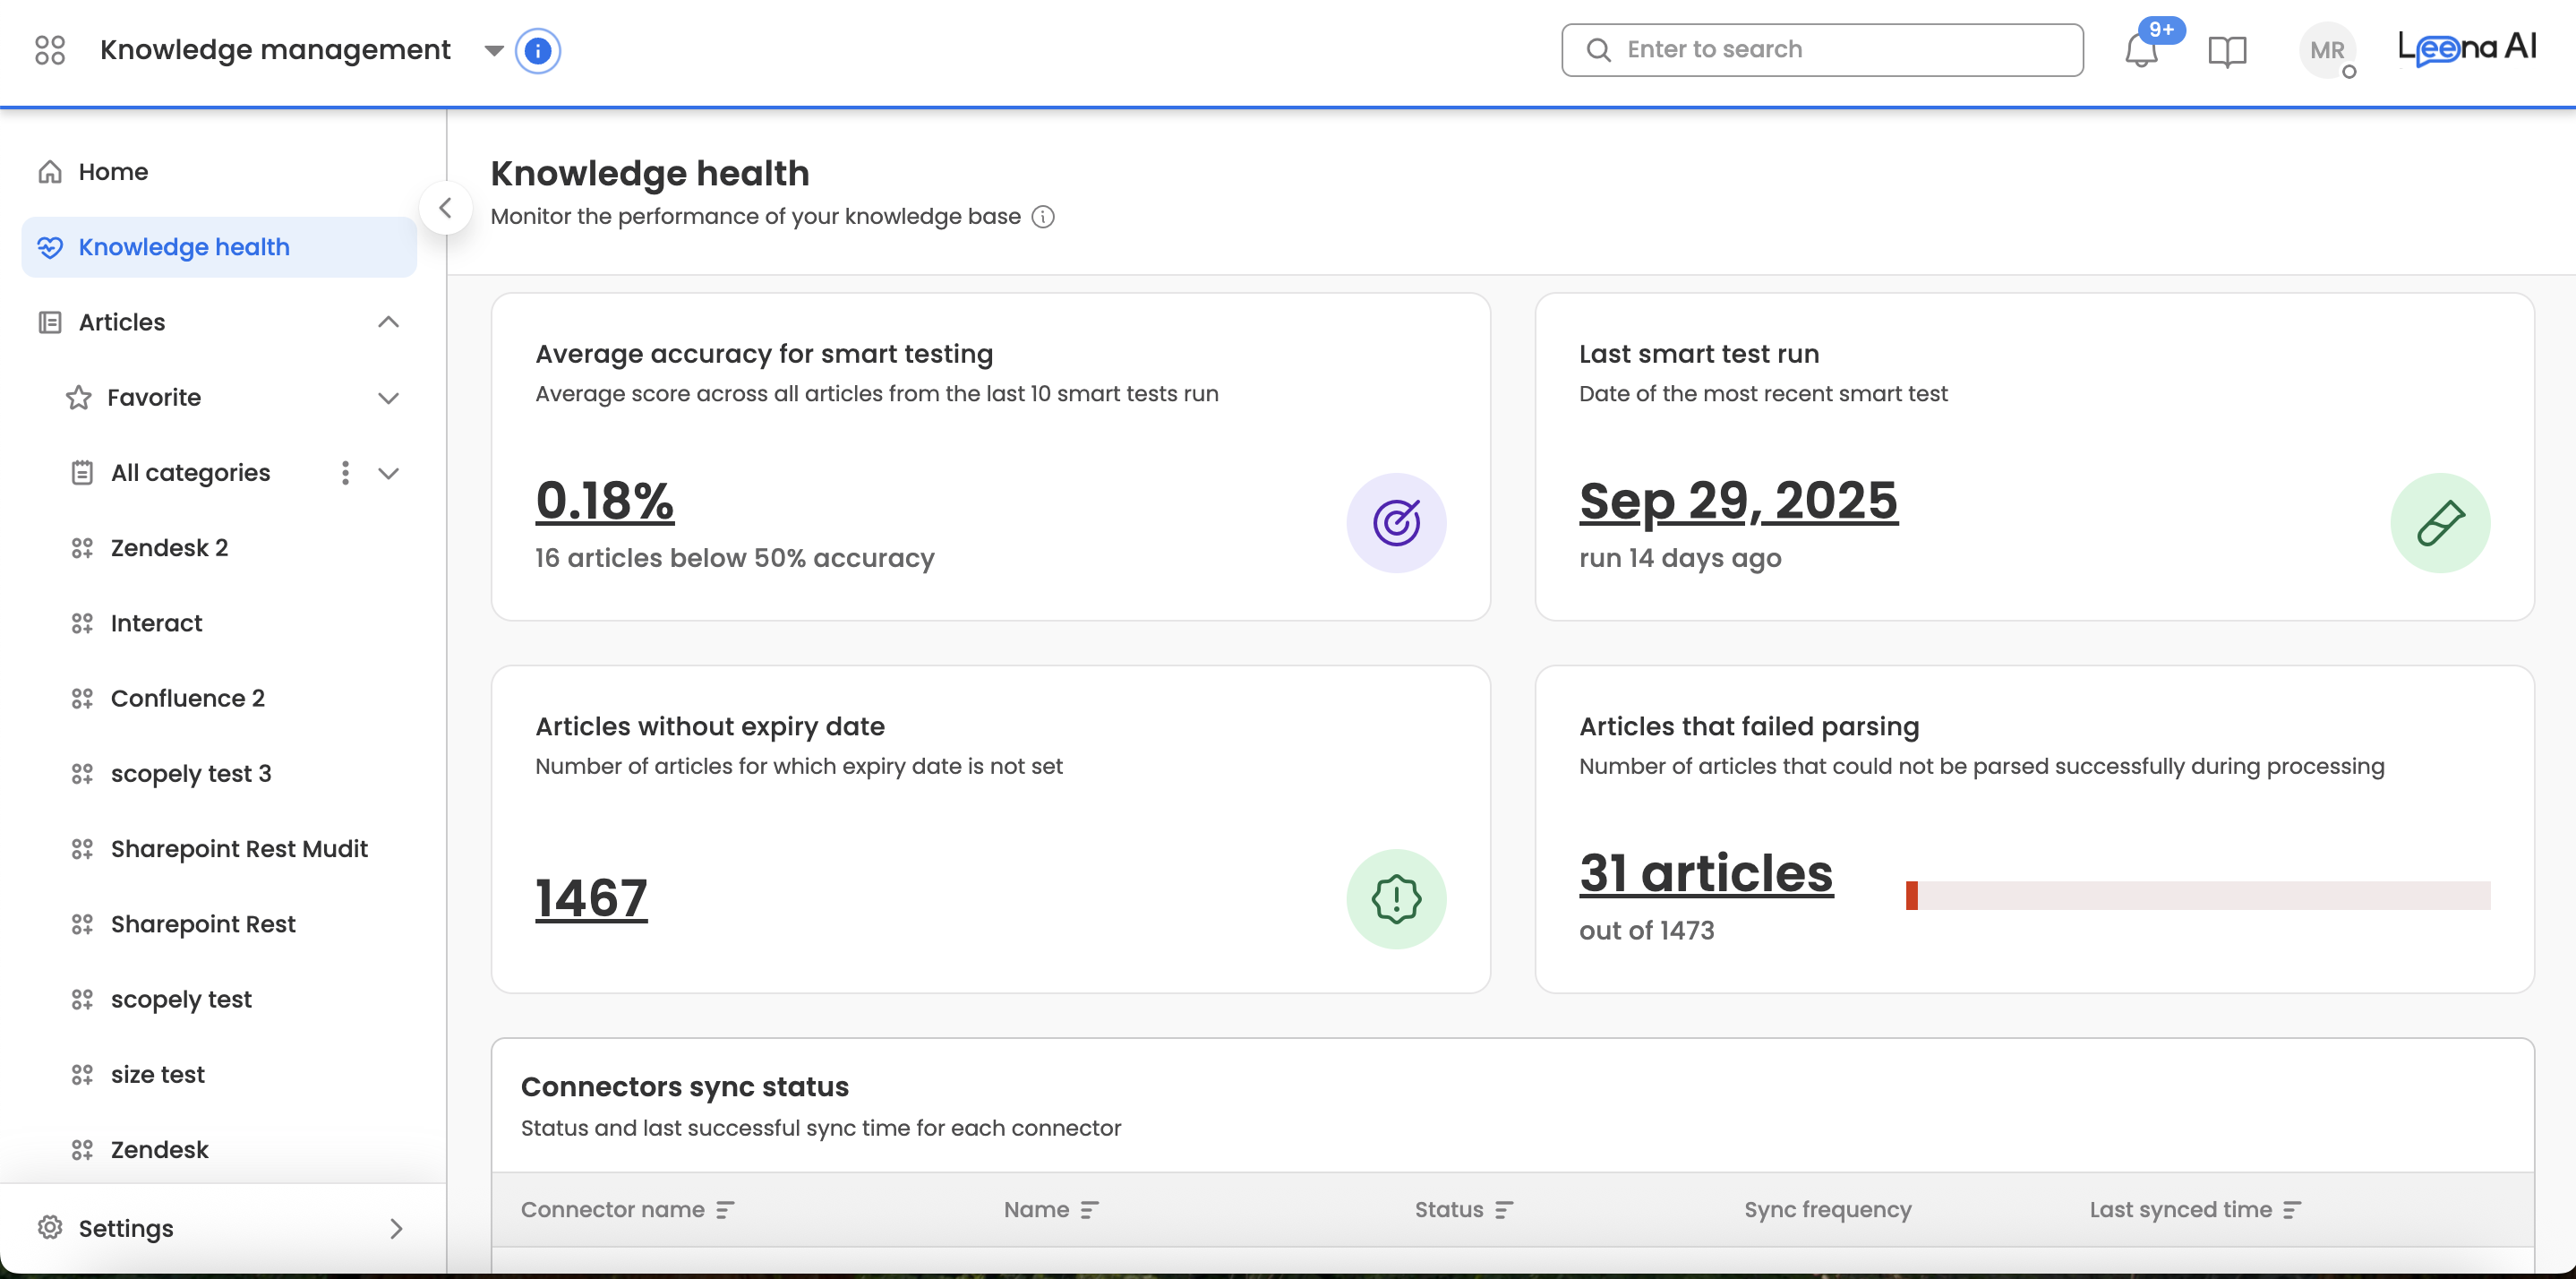
- Connectors Sync Status: This module ensures a reliable flow of information into the KM system. It provides a high-level status of all data connectors to quickly spot failures. The drill-down shows a detailed view with 'Connector Name', 'Type', 'Status', 'Sync Frequency', and 'Last Synced Time'.
- Articles That Failed Parsing: This identifies content the system couldn't process. It shows a count of articles that failed during the parsing stage. You can drill down to see a list of these articles and navigate to them directly to investigate the issue.
- Content Contribution Lifecycle: This identifies bottlenecks in the content pipeline. By highlighting articles stuck in 'Draft' or 'In Review' for too long, it helps ensure that new knowledge is finalised and made accessible to users in a timely manner.
AI Performance & Strategic Insights
- Smart Testing: This module tracks the performance and recency of our automated quality tests. It displays two key metrics: the average accuracy score from the last 10 test runs and the date of the most recent test. Clicking this module takes you to the main Smart Testing page for detailed analysis.
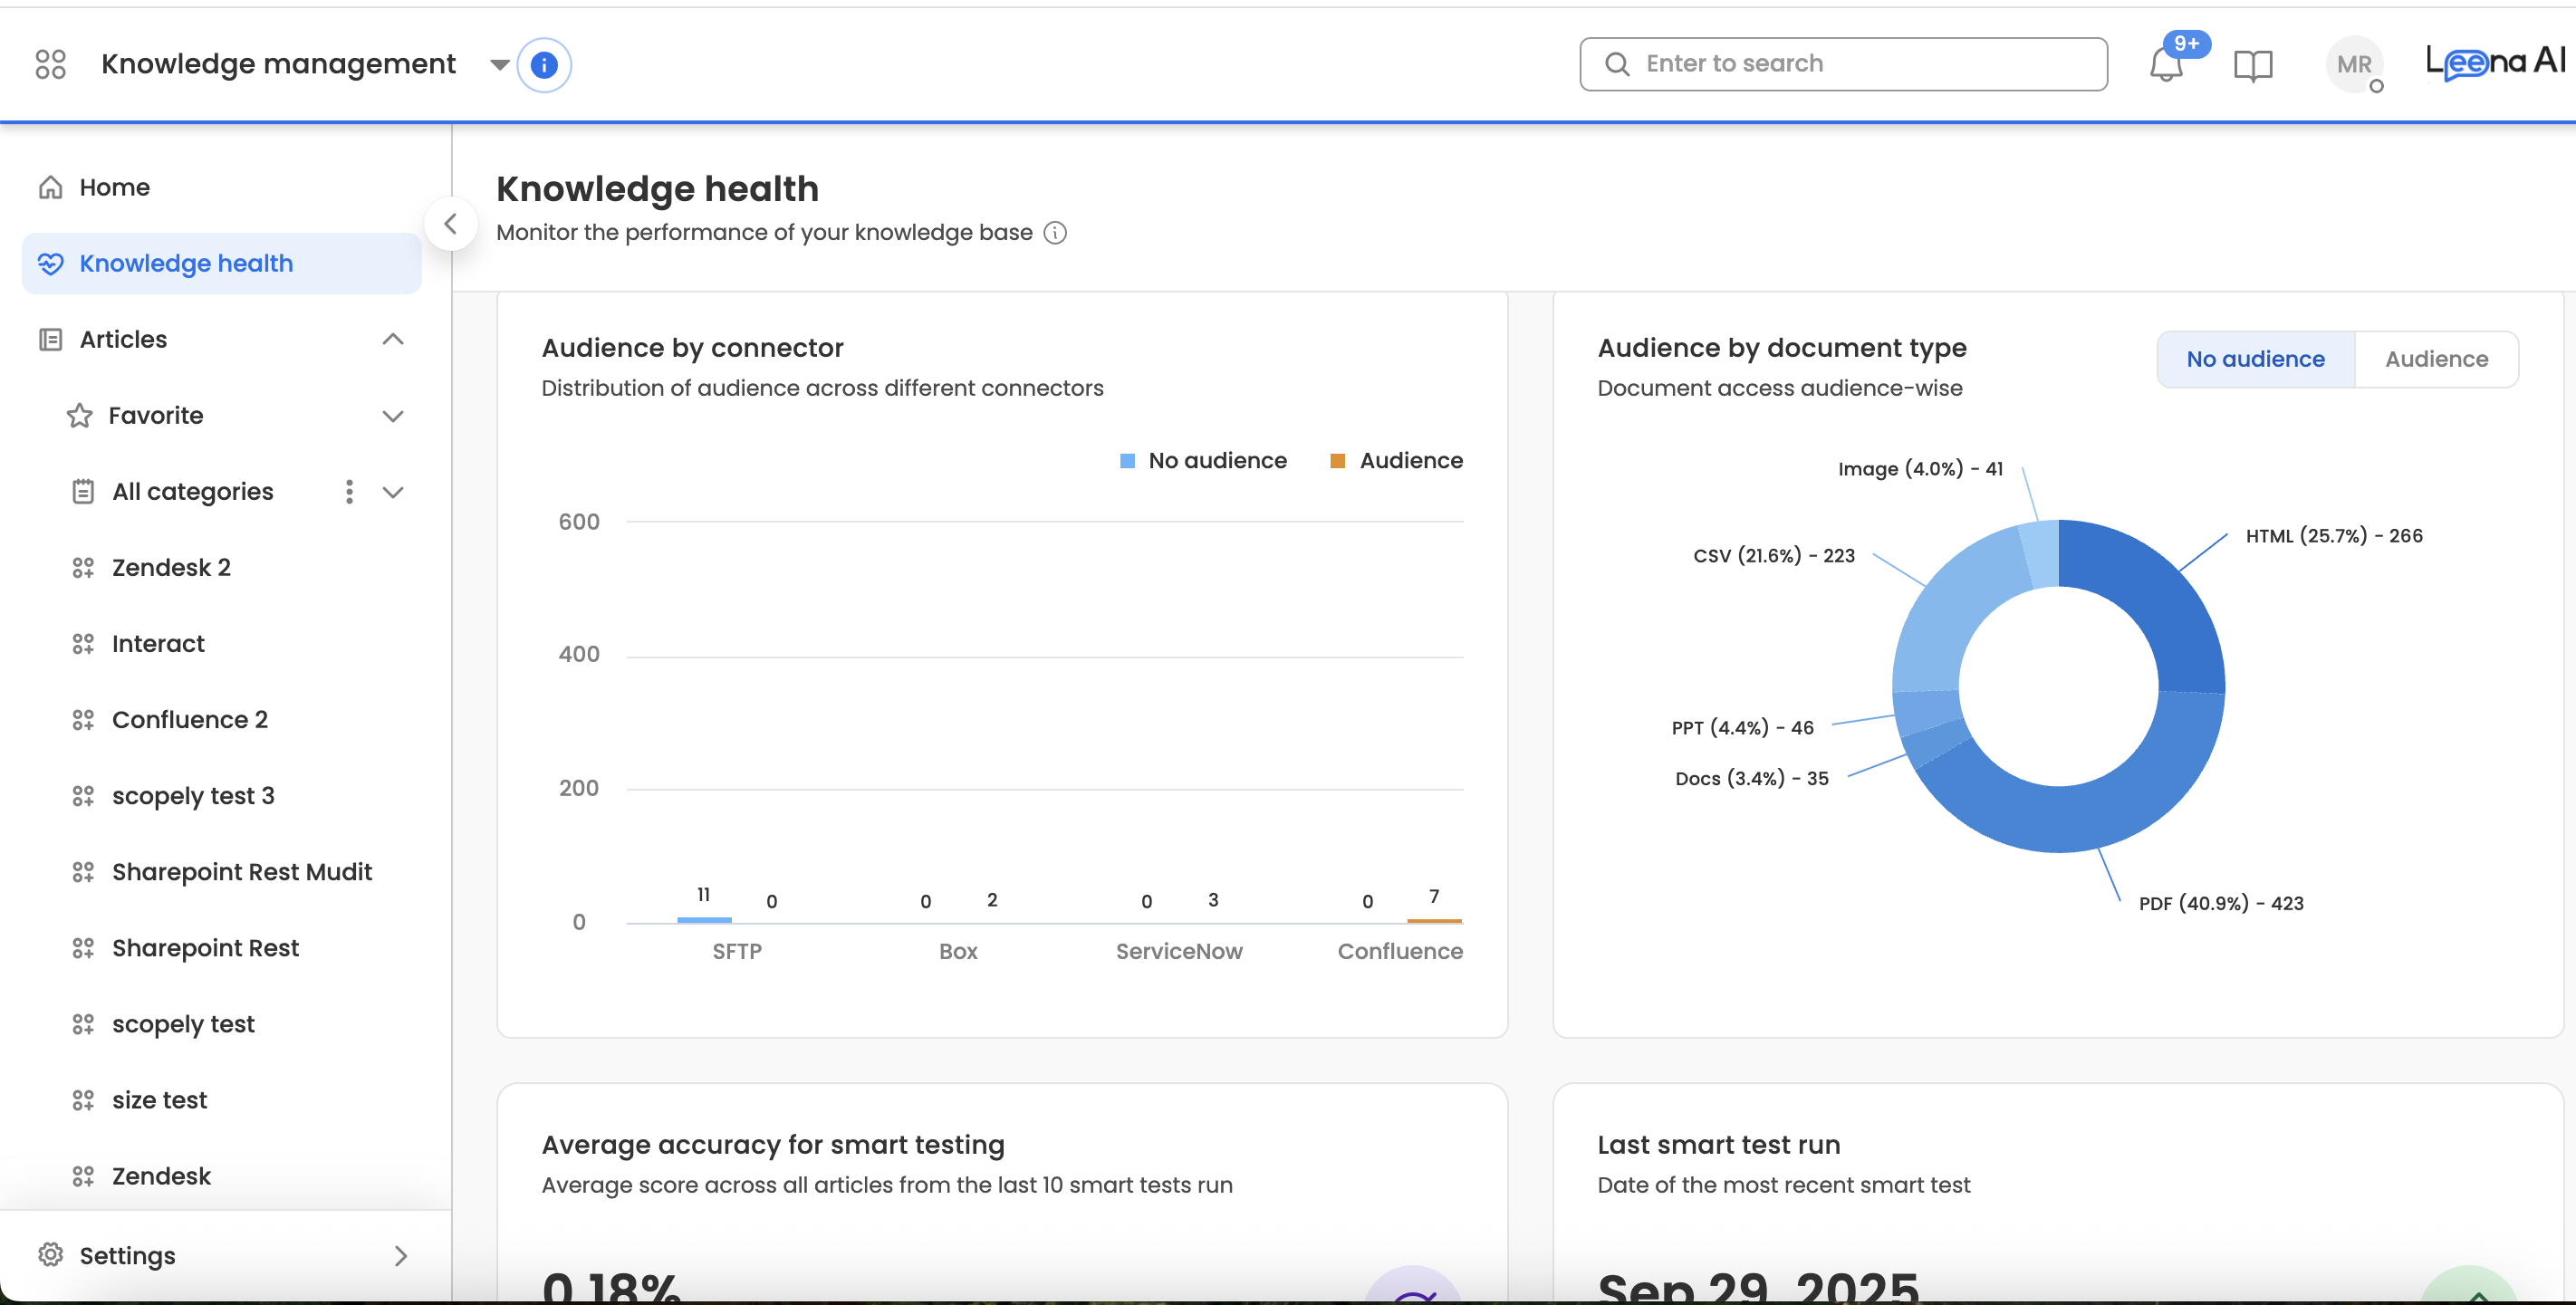
- Audience & Type Distribution: This provides a strategic overview of the accessibility of the knowledge base via a pie chart. By visualising content by visibility and type, it helps identify accessibility gaps and align strategy without needing a drill-down.
- Audience by Connector: It depicts the distribution of audience across different connectors/integrations.
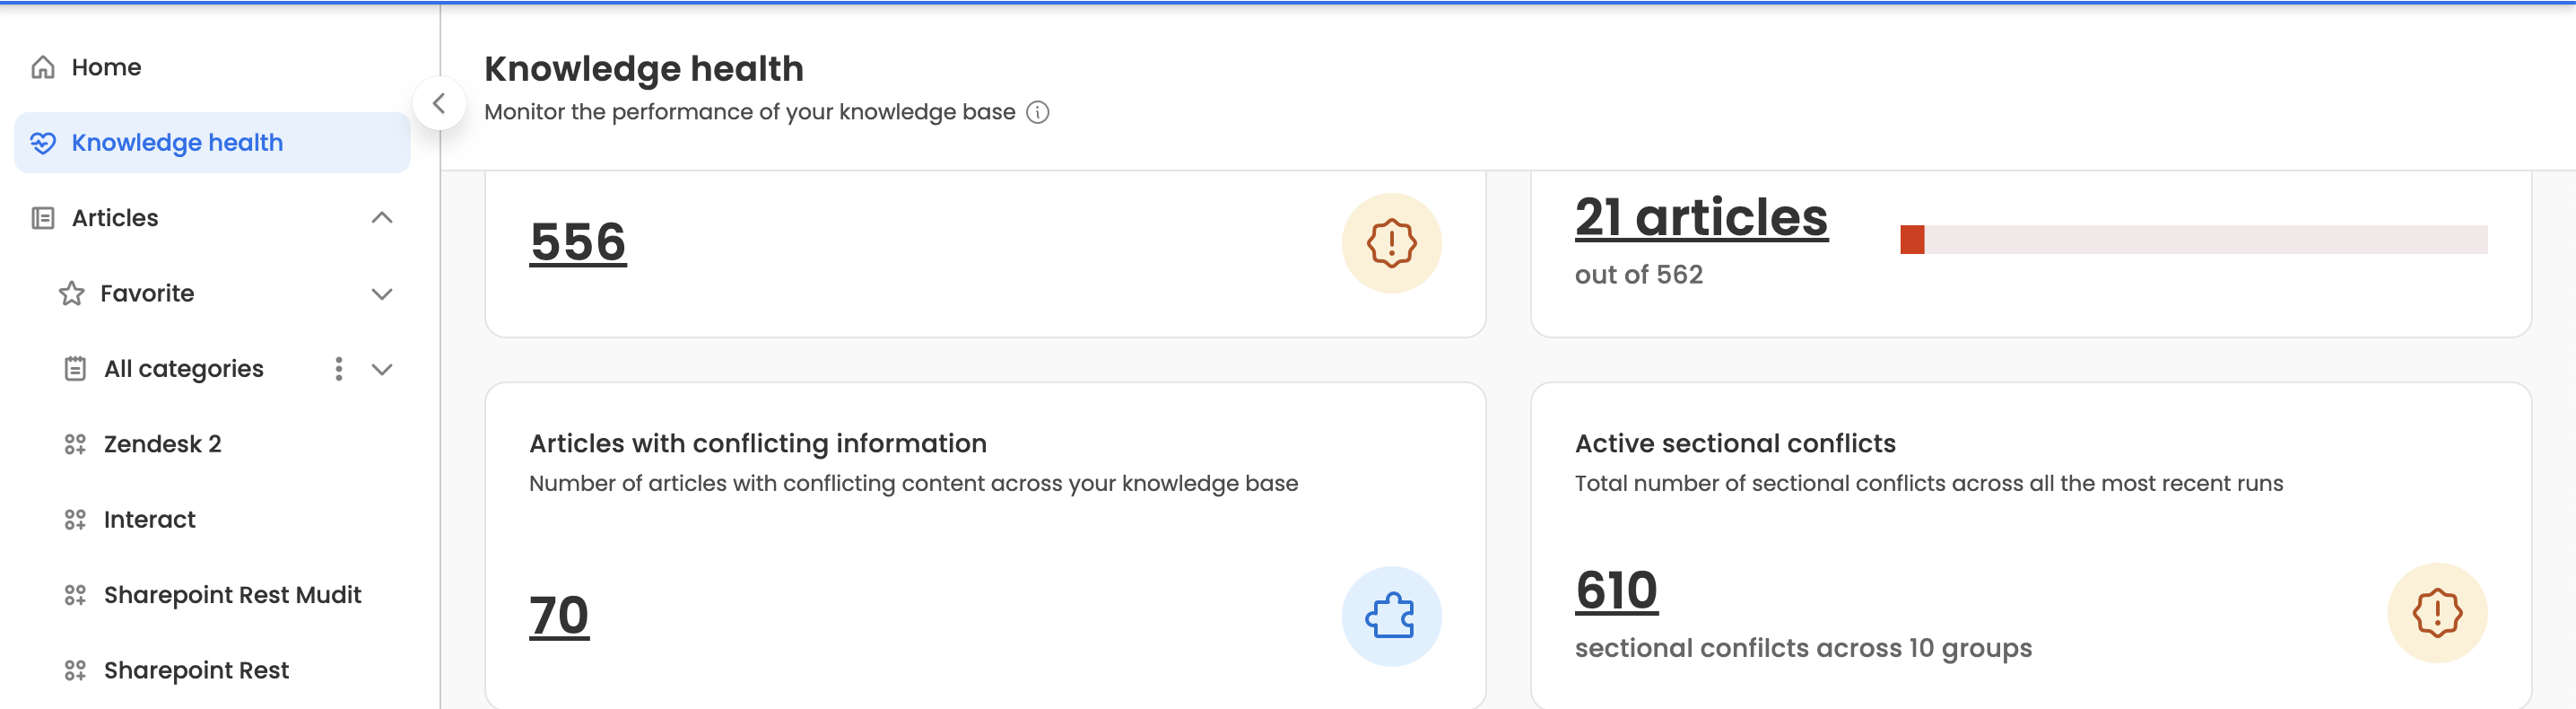
Conflict Analysis: It depicts the outcome of Conflict analysis and how many articles/sections have conflicting information within your Knowledge base. Ideal number to chase is zero.