
Audit Logs
Audit logs trace actions taken by any persona, summarising them in one place. Leena AI admins use them for compliance auditing and for root-cause analysis on production incidents.
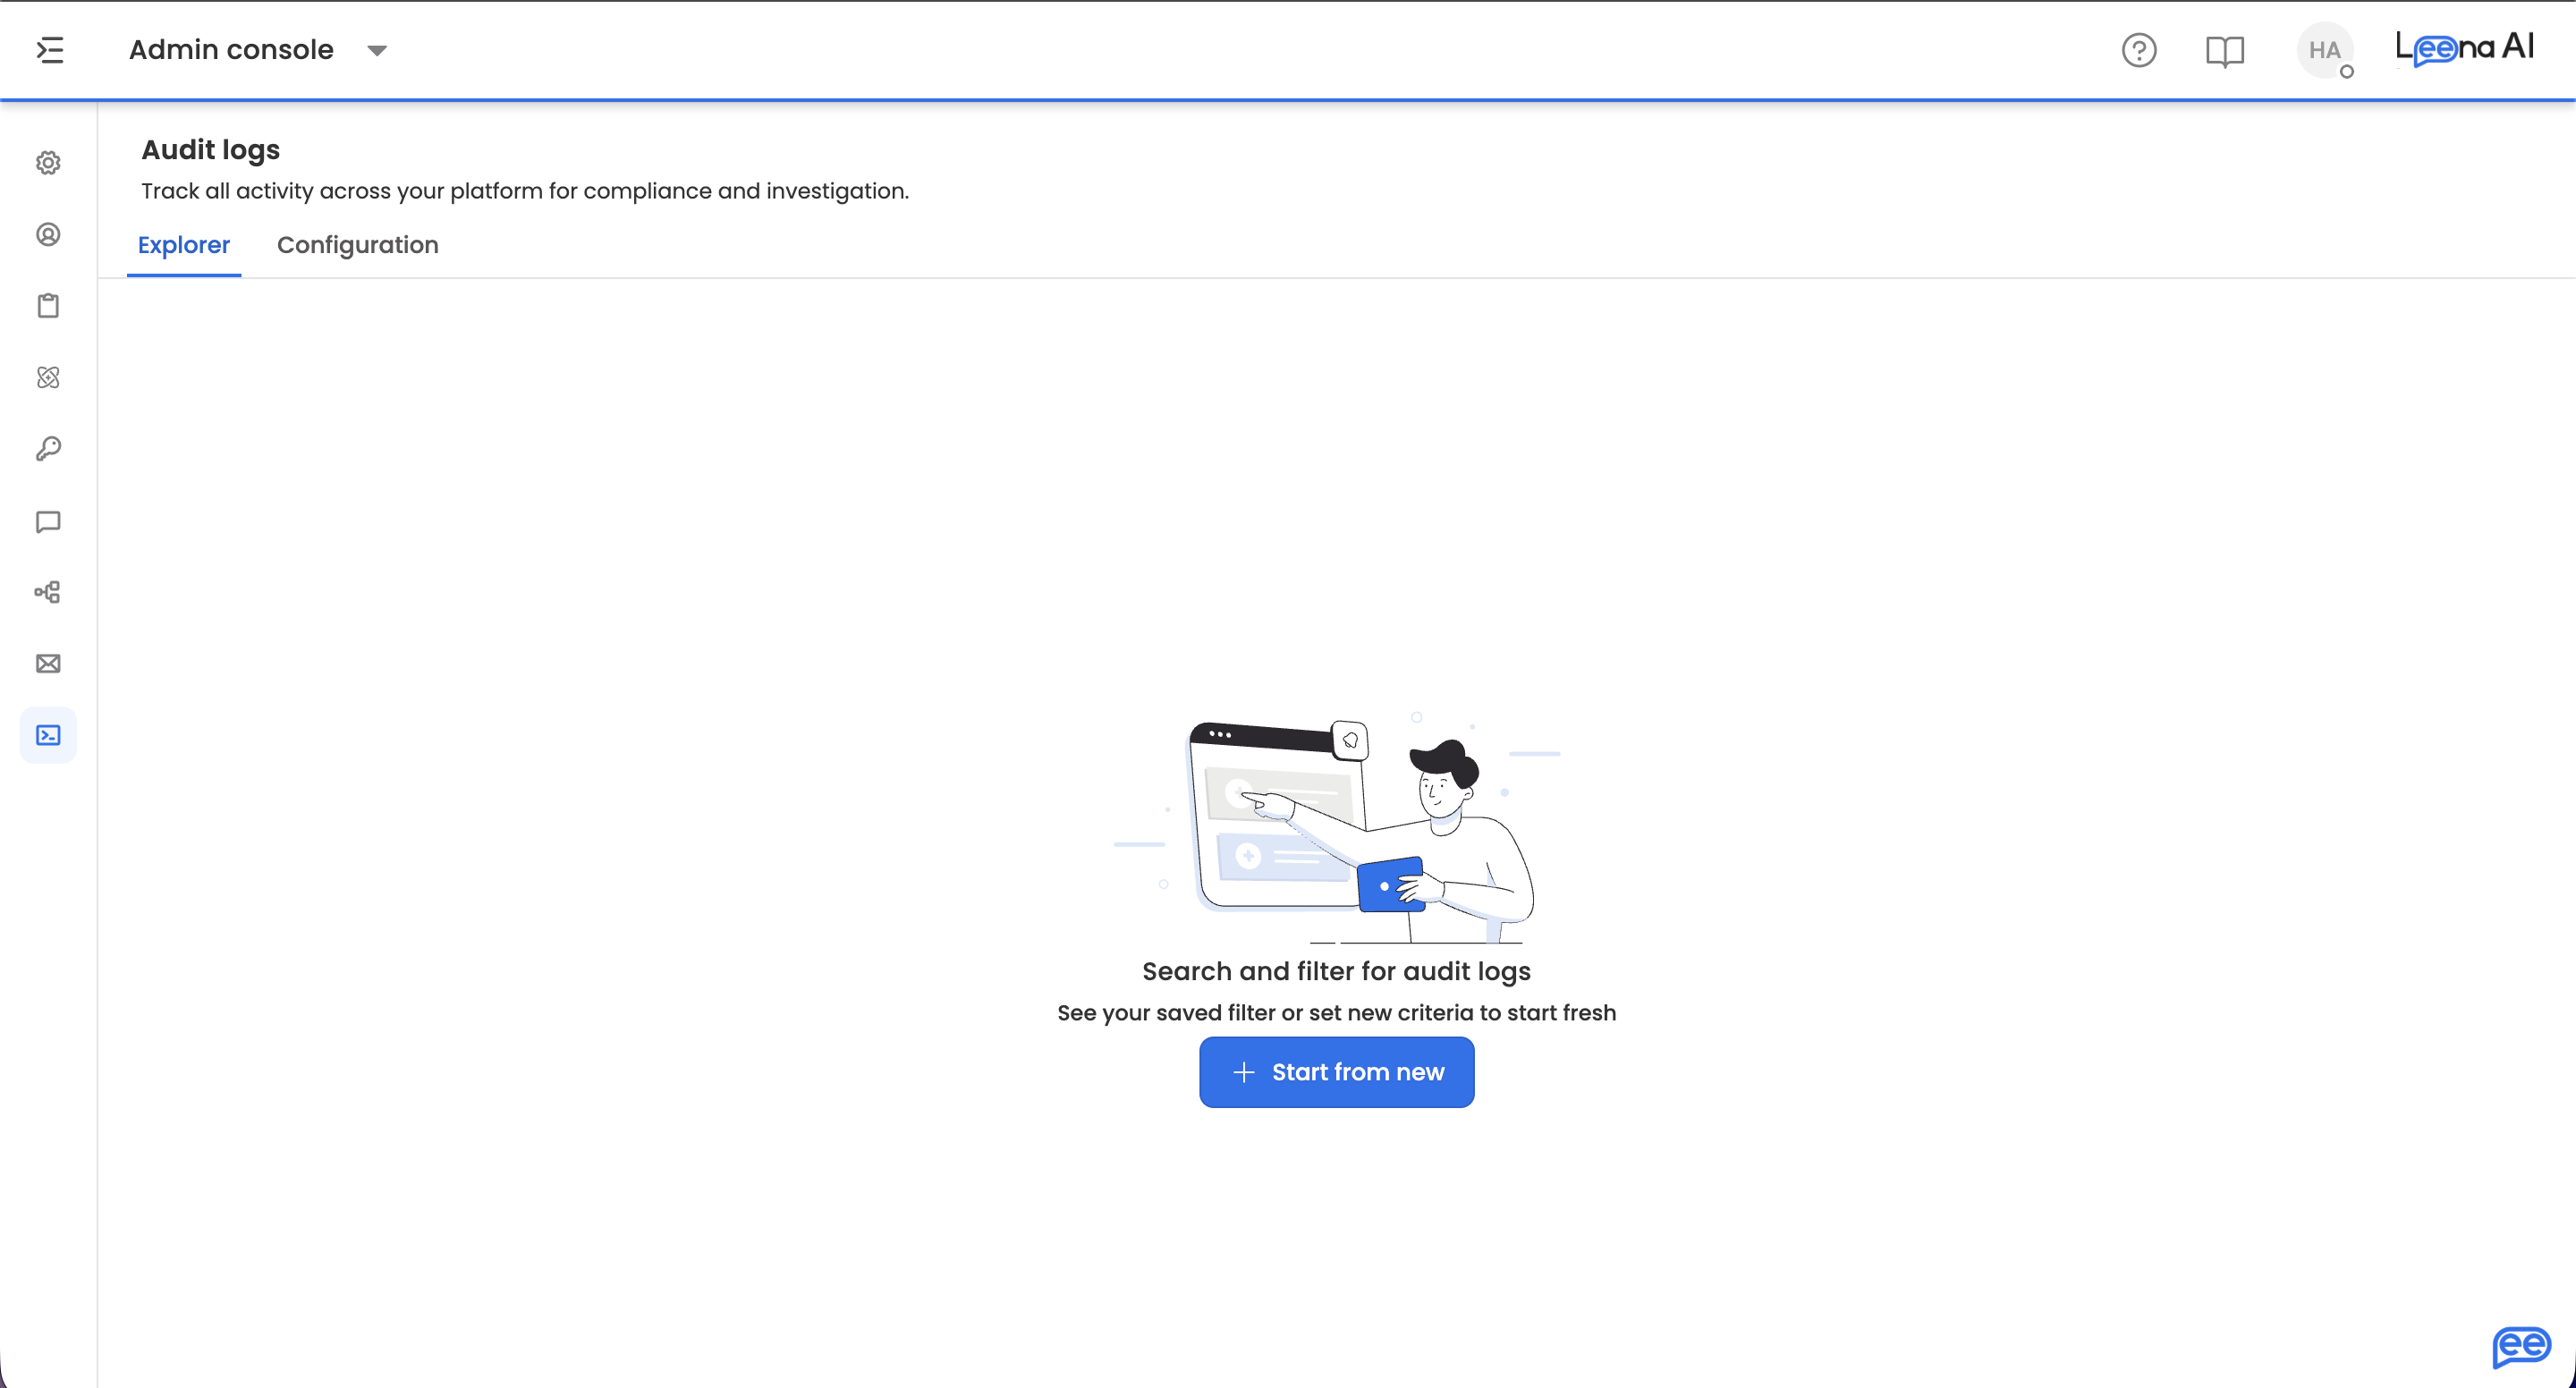
Where to find it
Open the Admin Console, then go to Logs → Audit Logs.
The section has two tabs:
| Tab | What it does |
|---|---|
| Explorer | Query events that have already been captured |
| Configuration | Control which events get captured in the first place |
Explorer is where the section opens.
Configuration decides what Explorer can showIf a module's logging is turned off under Configuration, no events are captured for it — and nothing will appear in Explorer for that module, including for the period before you noticed.
Audit logs are not retrospective. Set capture up before you need the trail, not when an incident prompts you to look.
AvailabilityAudit Logs requires a role granting audit log access, and isn't available on trial workspaces.
Explorer
Building a query
Click Start from new to create a filter.
- Select the product module from the Component ID dropdown.
- The relevant filters for that module appear below — event type, status, start date, end date, priority, and so on.
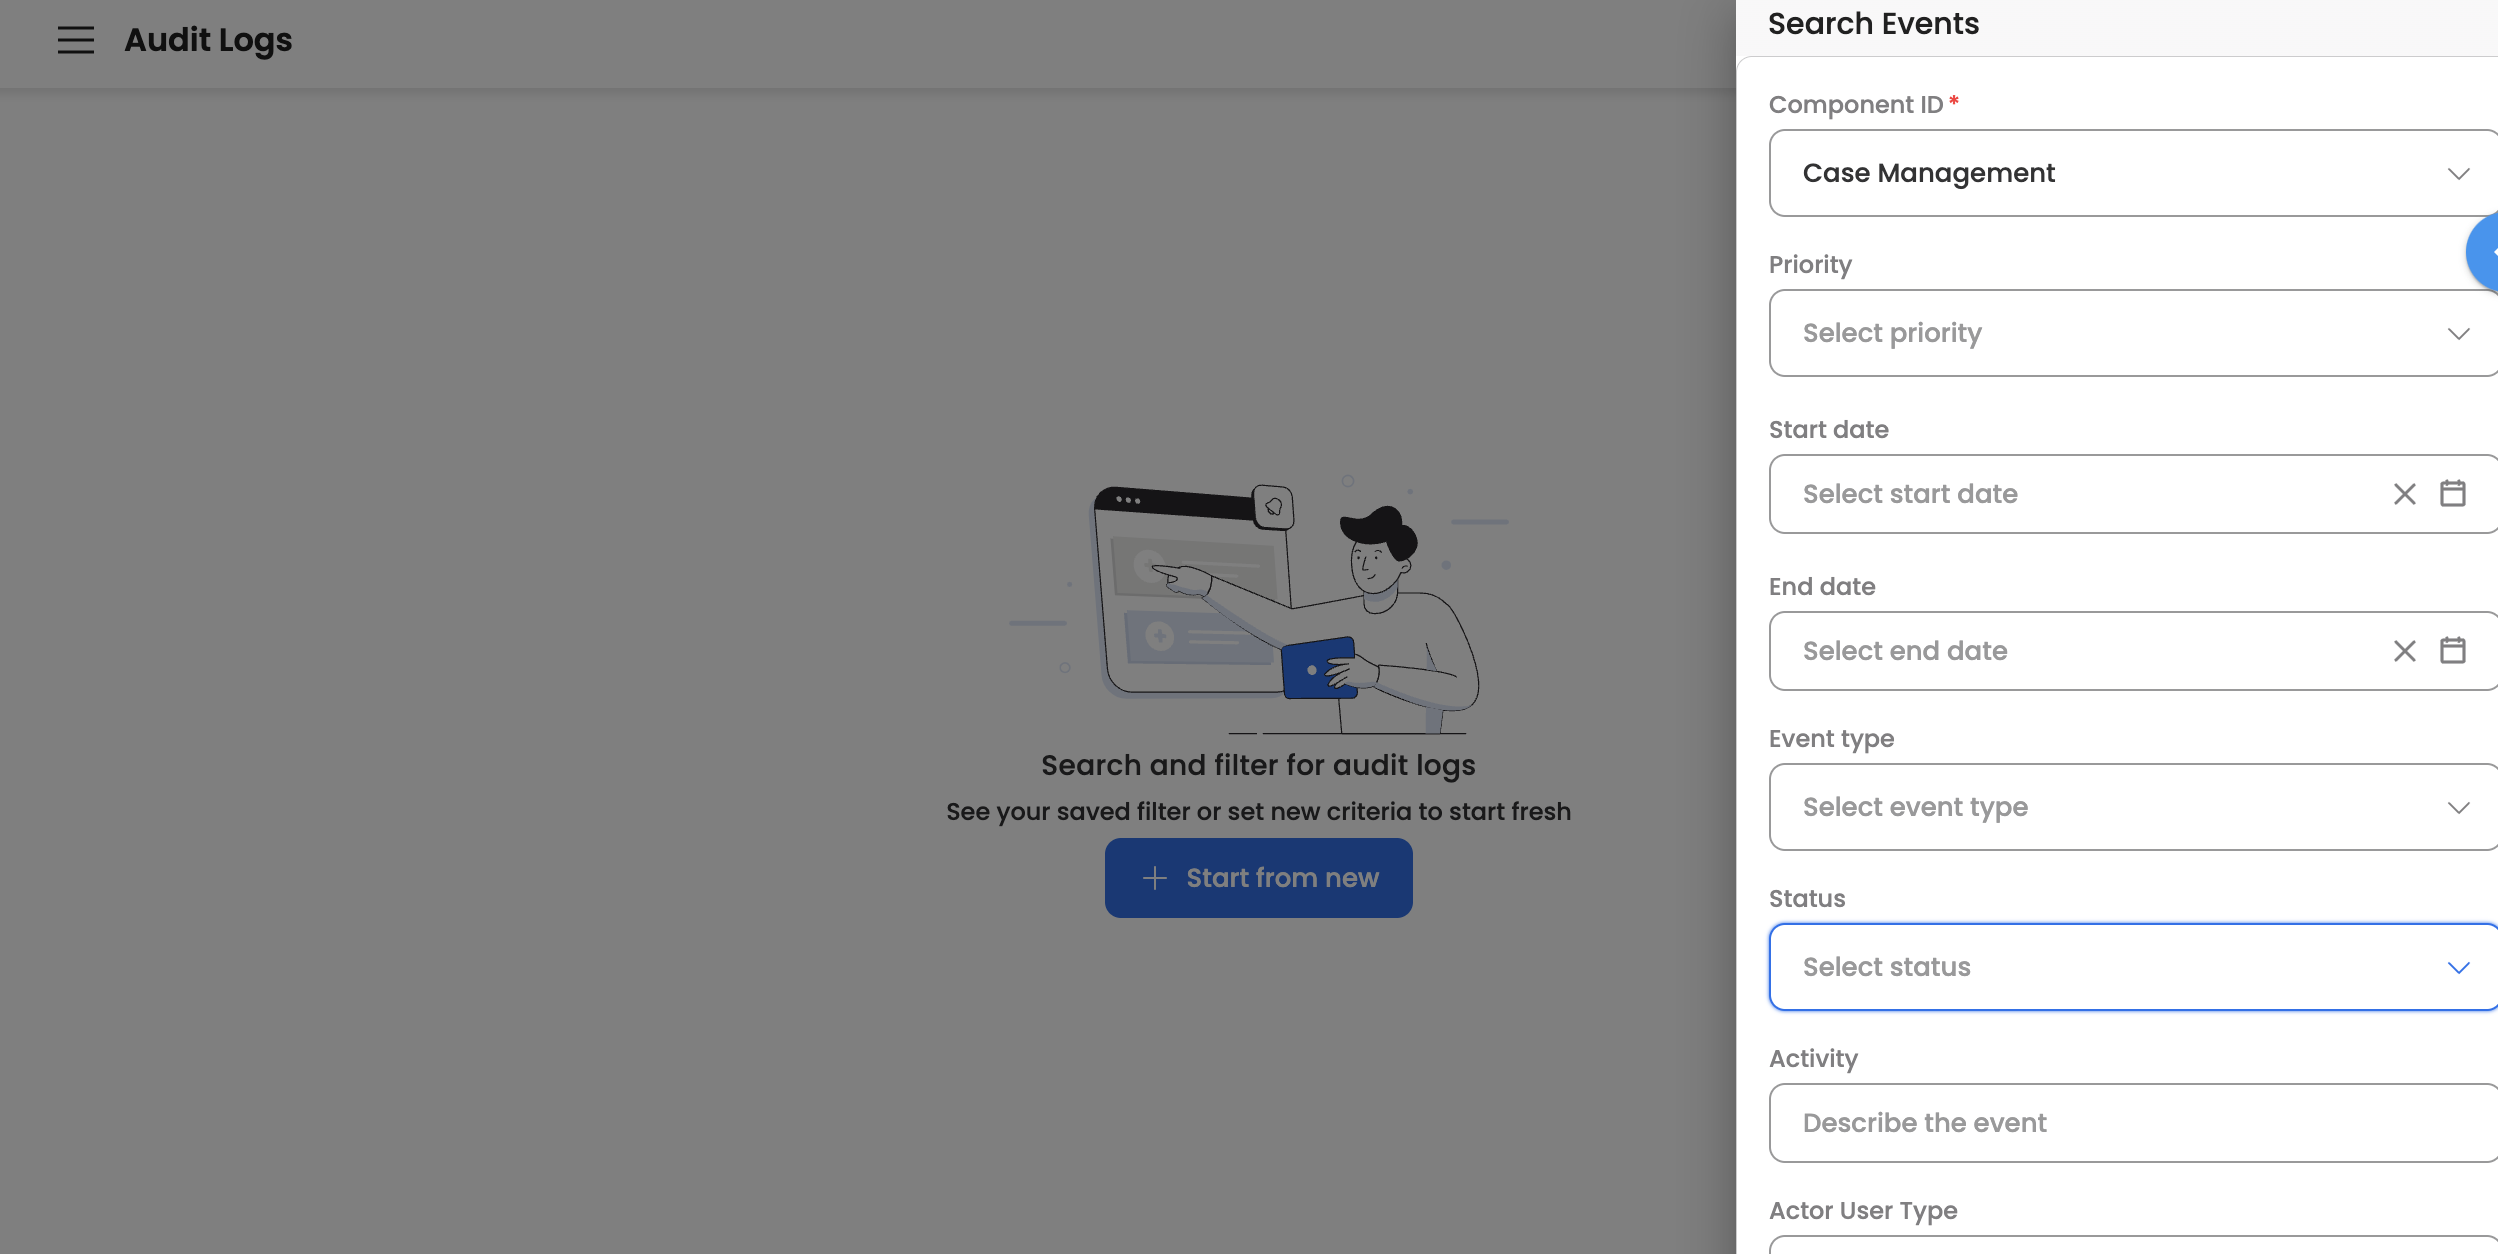
- Click Apply to see the matching events.
The results table
| Column | What it shows |
|---|---|
| Event Type | Name of the event or activity. A flag icon appears if the event has been flagged |
| Submodule name | The submodule the event came from, where it has one |
| Priority | Priority defined by the user or system, if available |
| Action User | The user who took the action |
| Target User | The user the action was directed at |
| Status | Whether the action succeeded or failed |
| Date | When the action was executed |
| Actions | Kebab menu with View event and Flag event / Unflag event |
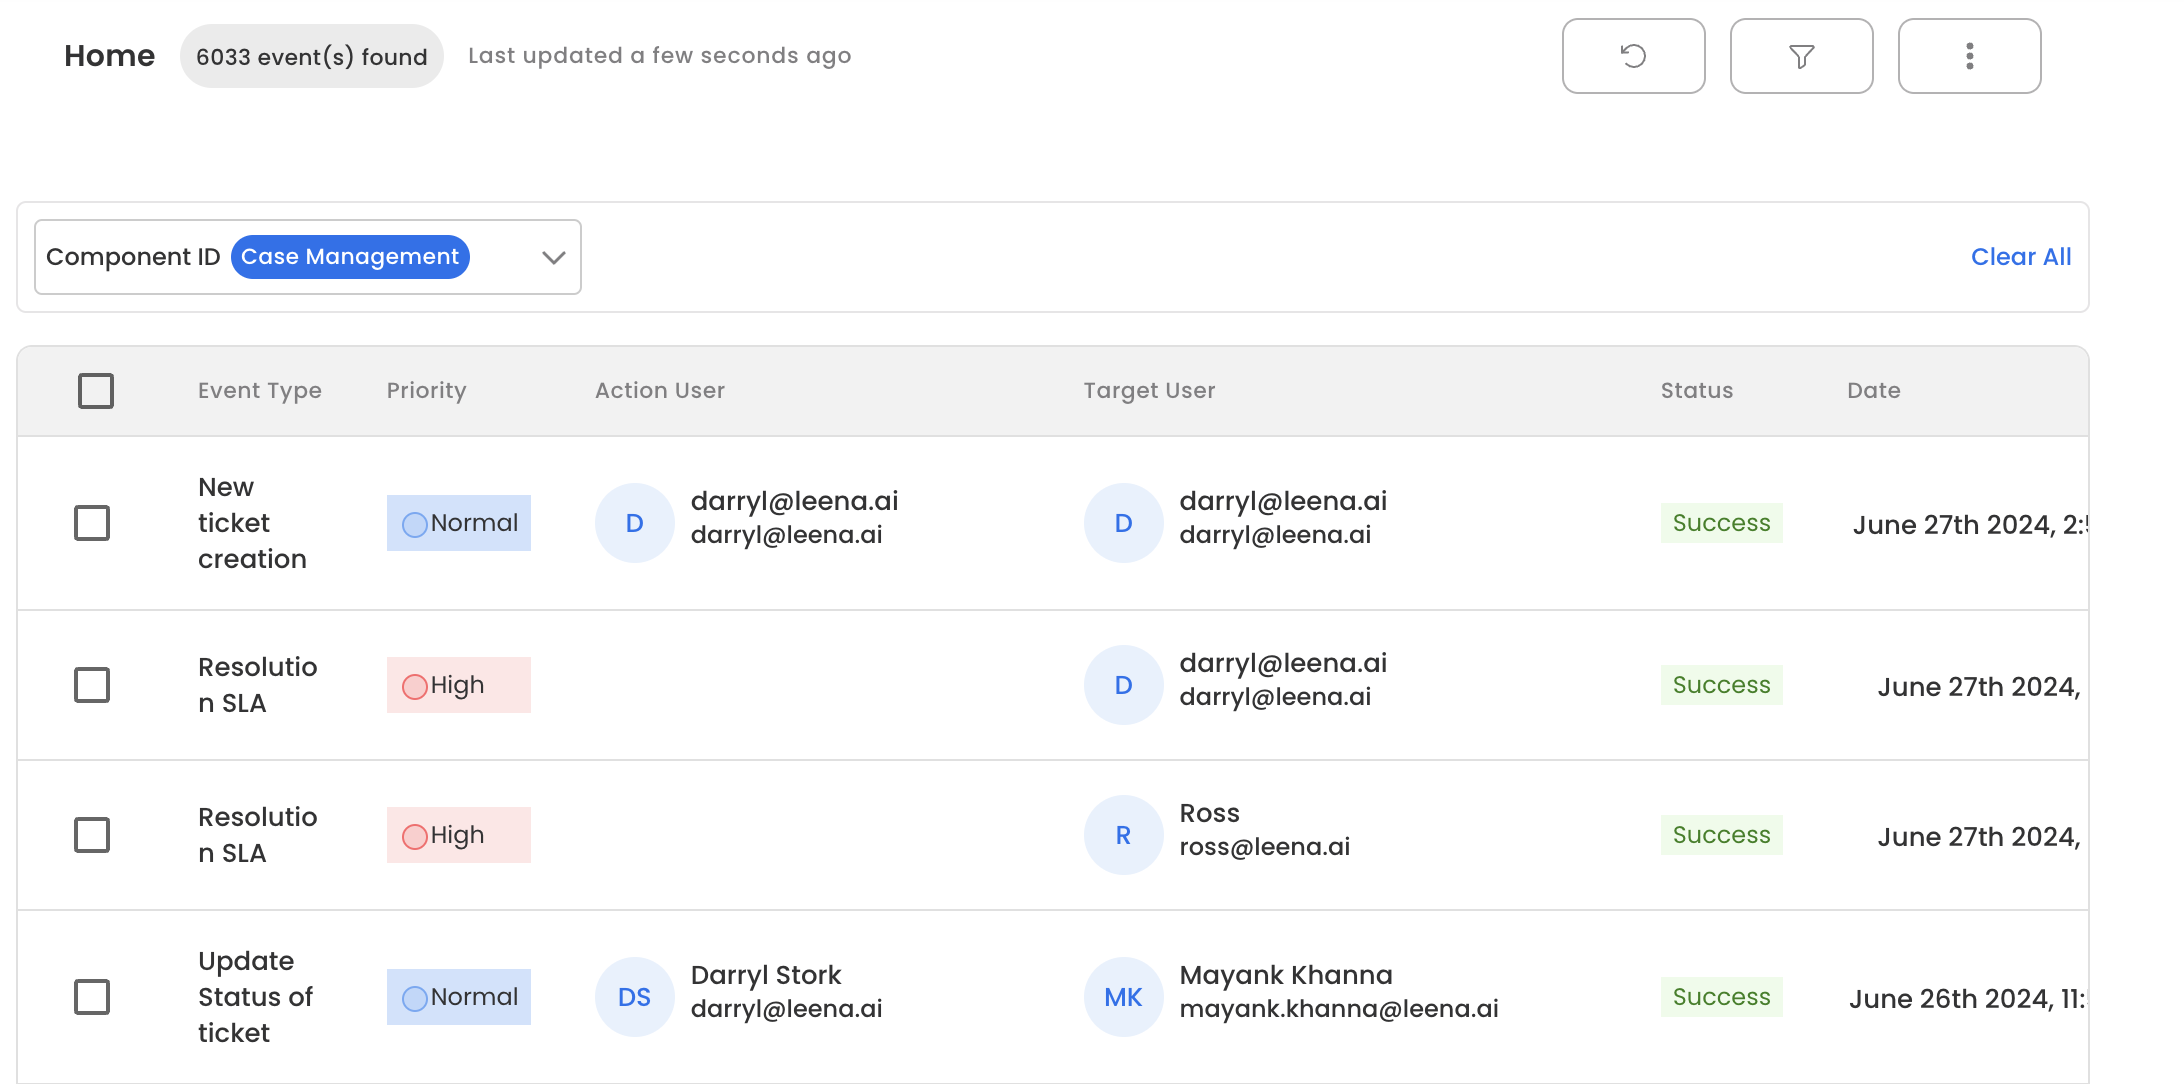
The Action User and Target User distinction is what makes an investigation tractable: one is who did it, the other who it was done to. An administrator deactivating an account is the action user, with the deactivated employee as the target.
Event detail
Clicking an event opens a drawer with the full context:
| Section | What it holds |
|---|---|
| Event metadata | Event ID, ingested date and time, component module |
| Event details | Submodule name, event type, activity description, priority, status |
| Action user | User type (Dashboard / Bot / System), name, email, and the IP address of the device the action came from |
| Target user | Where applicable — user type, name, email, and current account status (Active / Terminated) |
| Flagging info | Who flagged the event, if it has been flagged |
| View update | A link through to the configuration page the action affected, where applicable |
| Other Details | A collapsible accordion holding any additional module-specific metadata |
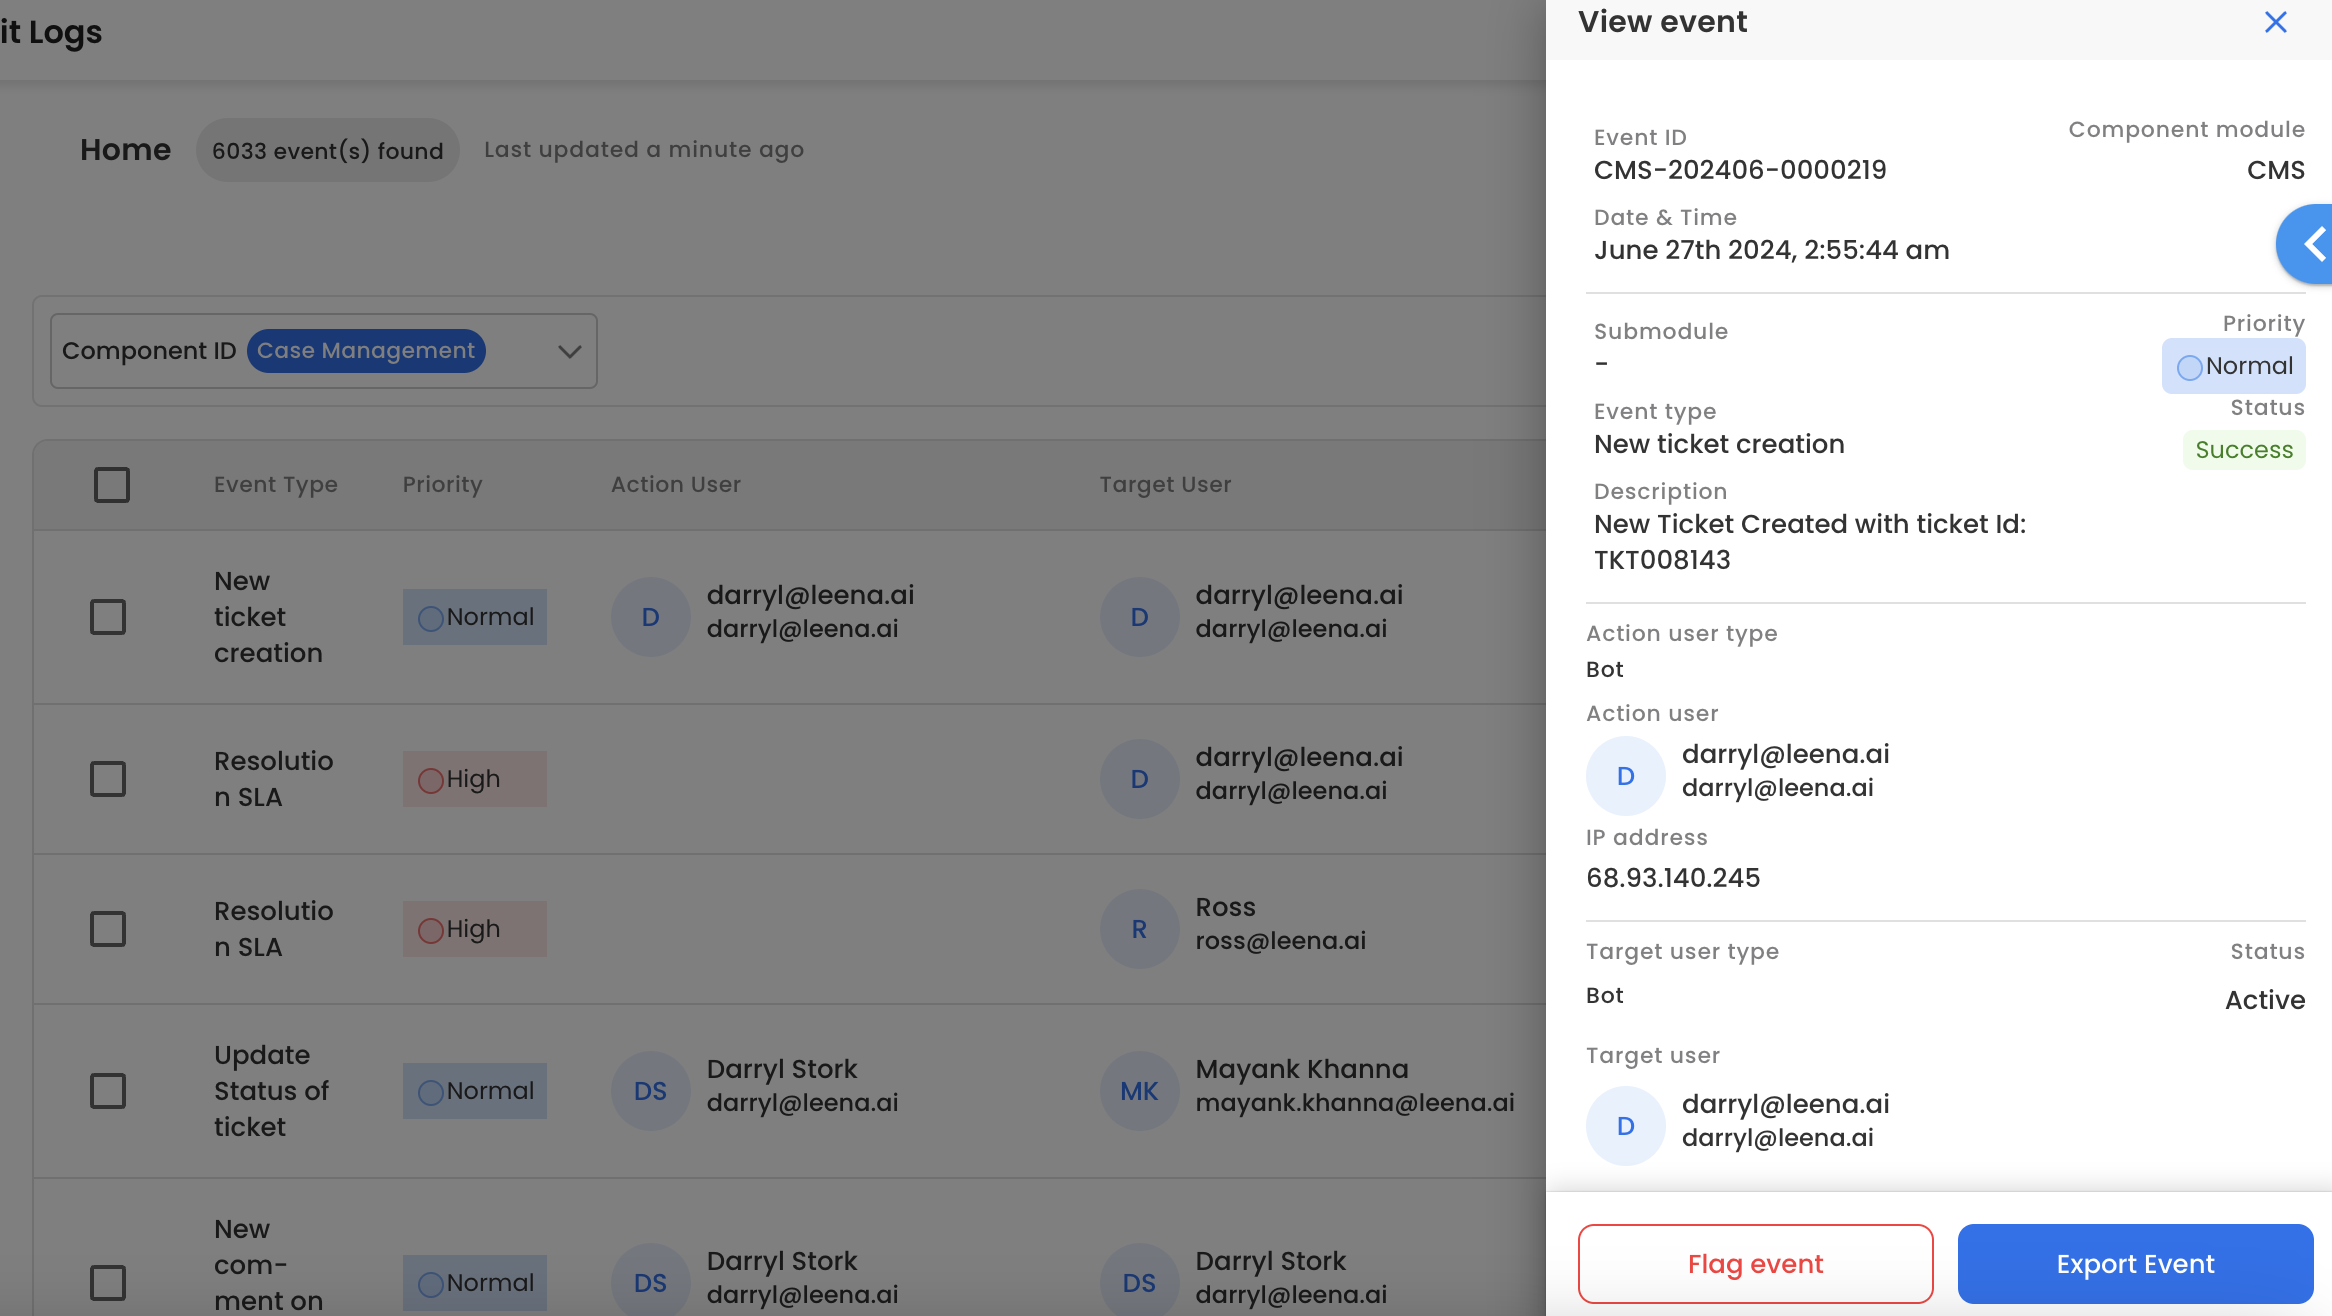
View update is the fastest route from "this changed" to "here's the setting that changed" — it saves reconstructing which screen an event refers to.
The details of a single action can be exported as CSV with Export Event.
Flagging
Flag an event for later review from the event drawer or the kebab menu on the table row. Flagging is a way to come back to something, and the action user is also notified that one of their actions has been flagged.
Bulk actions
Select multiple rows and the header offers Flag Selected and Export Selected.
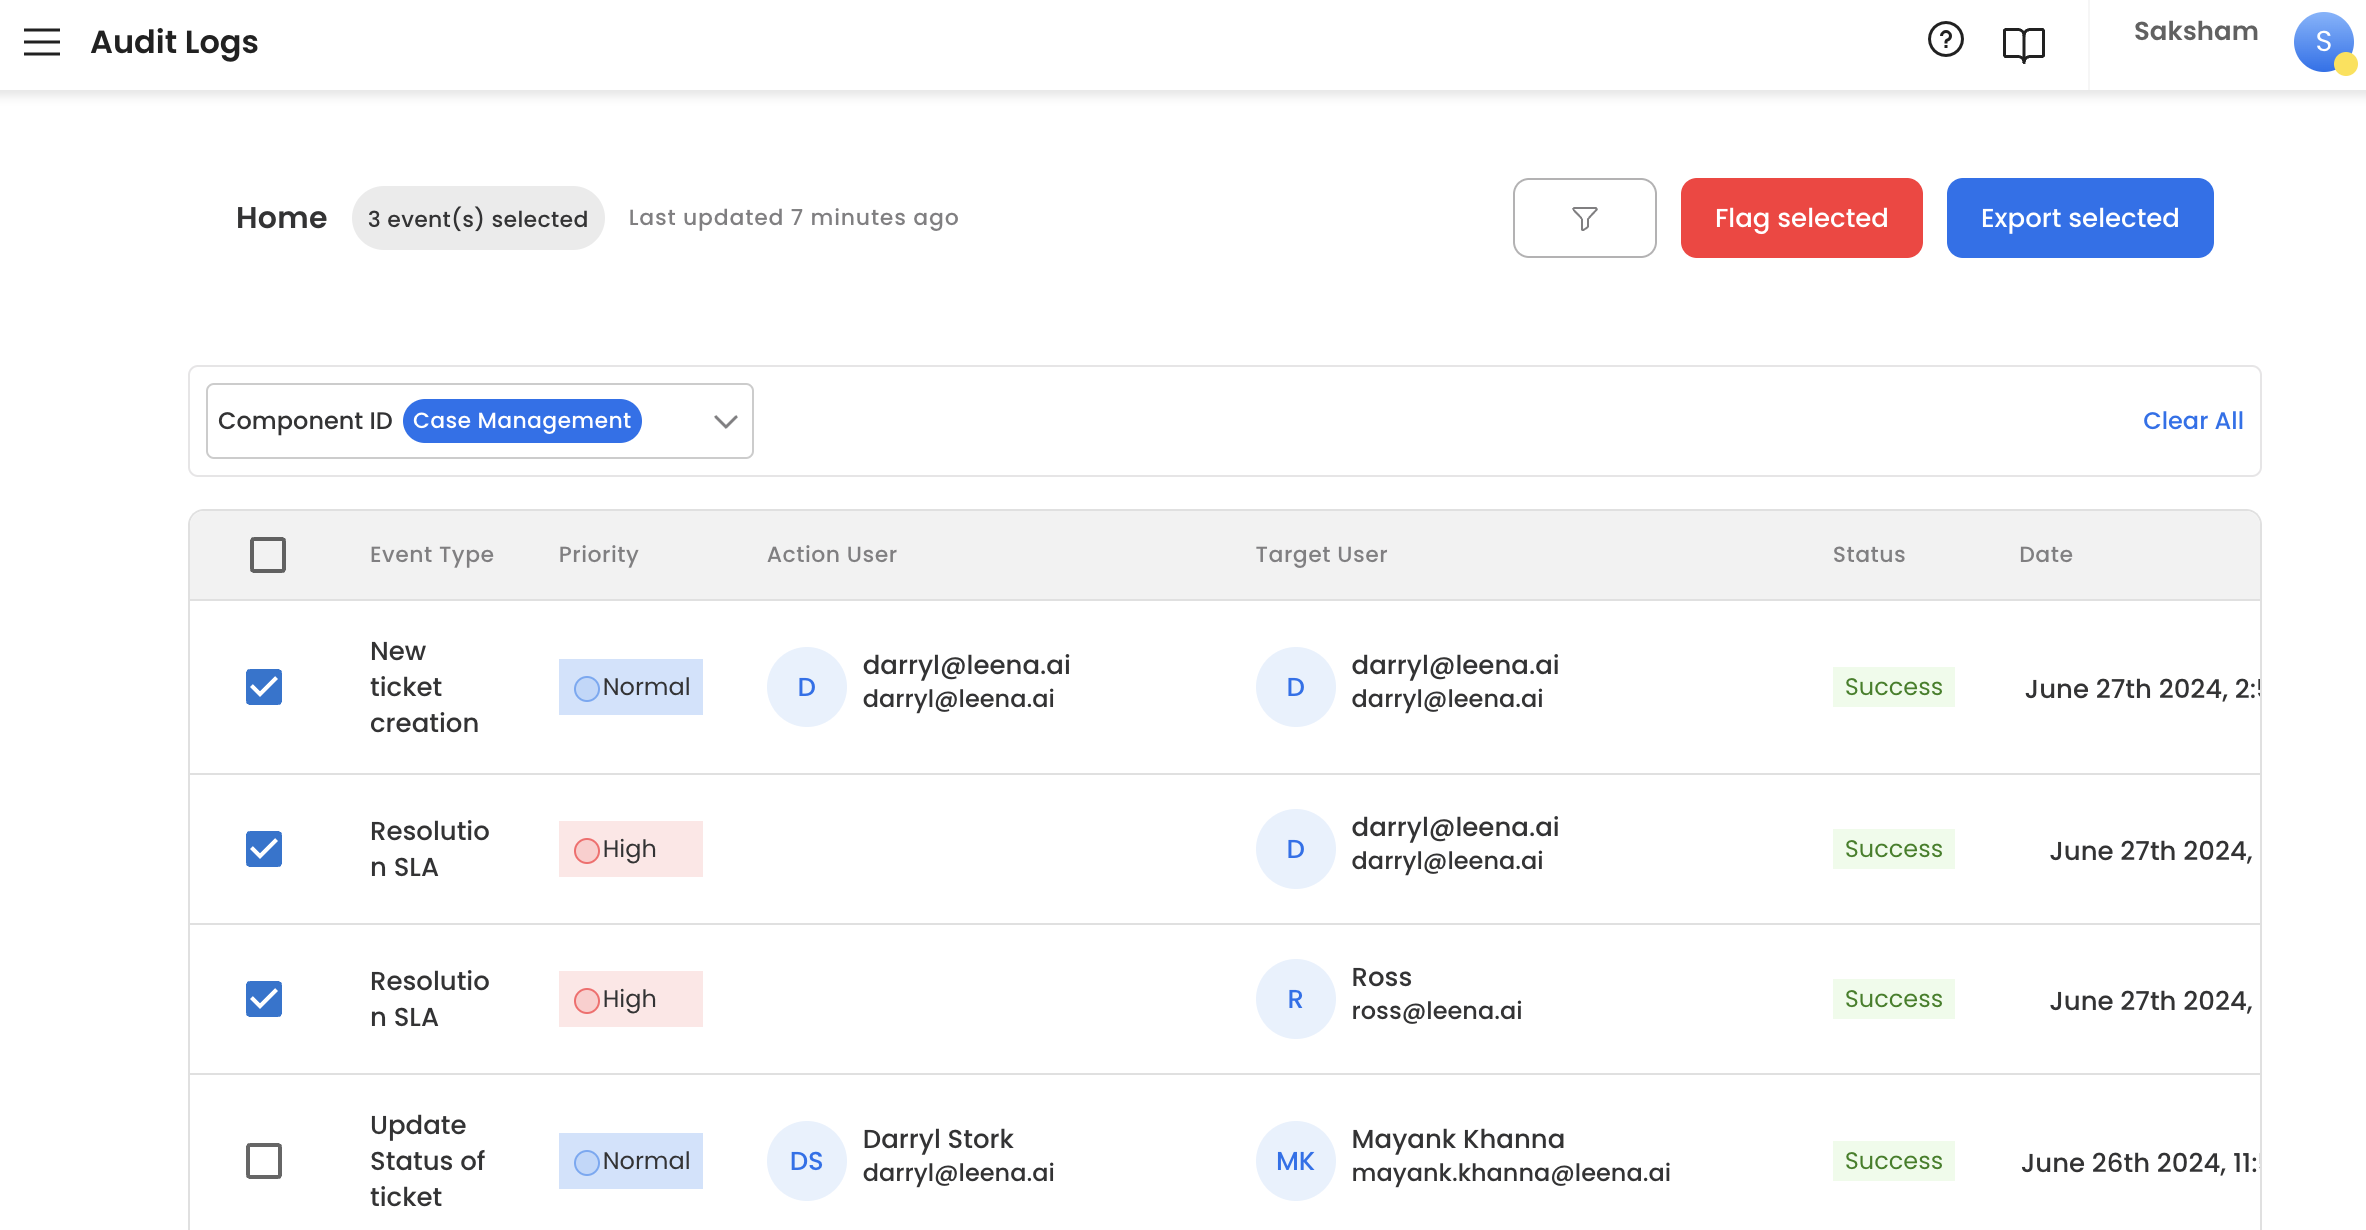
To download the whole filtered set, use the three-dots icon at the top right and choose Export Log.
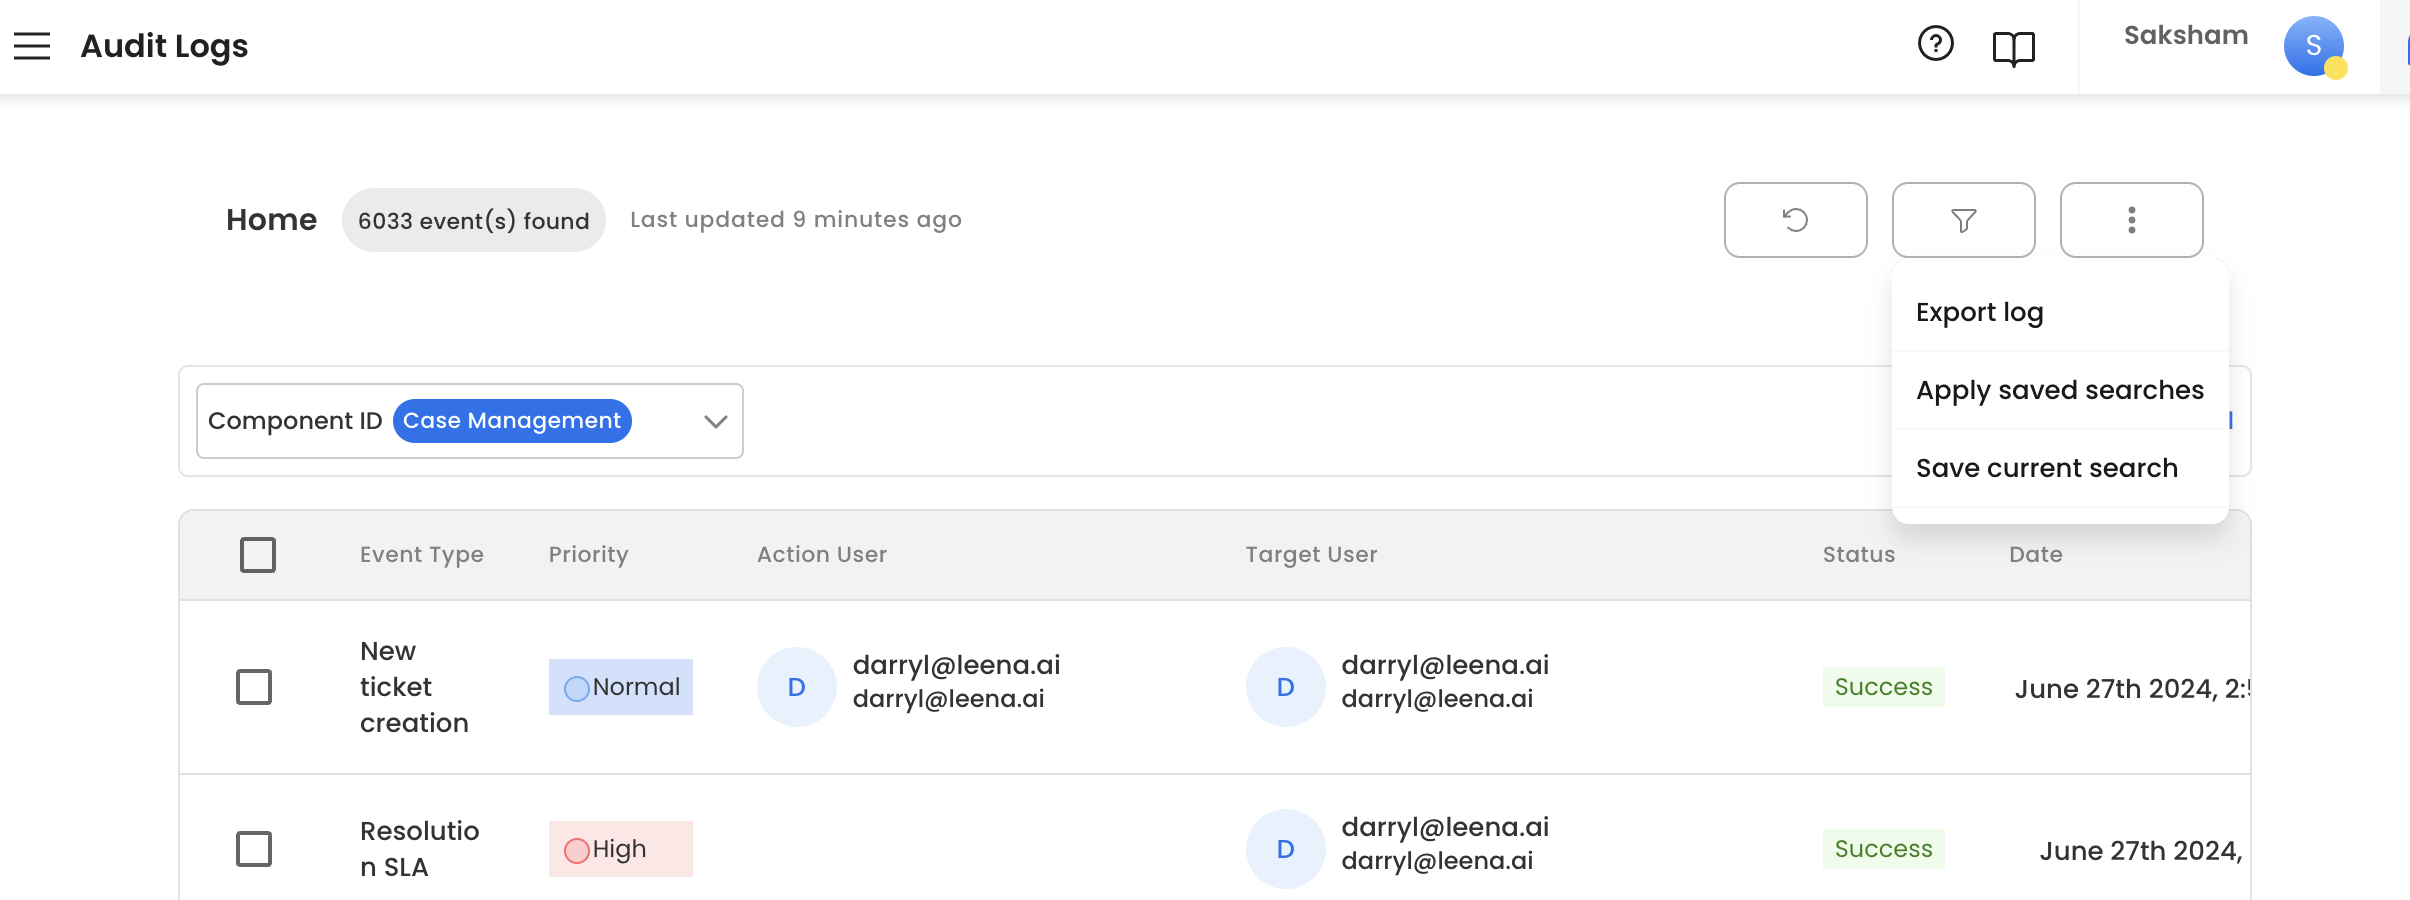
Export what a specific review needs rather than everything. Audit exports carry user identifiers, email addresses and IP addresses, and become sensitive material the moment they leave the platform.
Saved filters
Filter combinations you use repeatedly can be saved and reapplied — worth setting up for recurring compliance work such as a monthly KM access audit or a quarterly RBAC review.
- After applying filters, click Save filter, give it a name and an optional description, and save.
- Open the Saved filters dialog to apply, edit, or delete them.
- Saved filters are stored per dashboard user, so they aren't shared with colleagues. A review that has to survive someone leaving needs documenting elsewhere.
Configuration
The Configuration tab controls what gets captured.
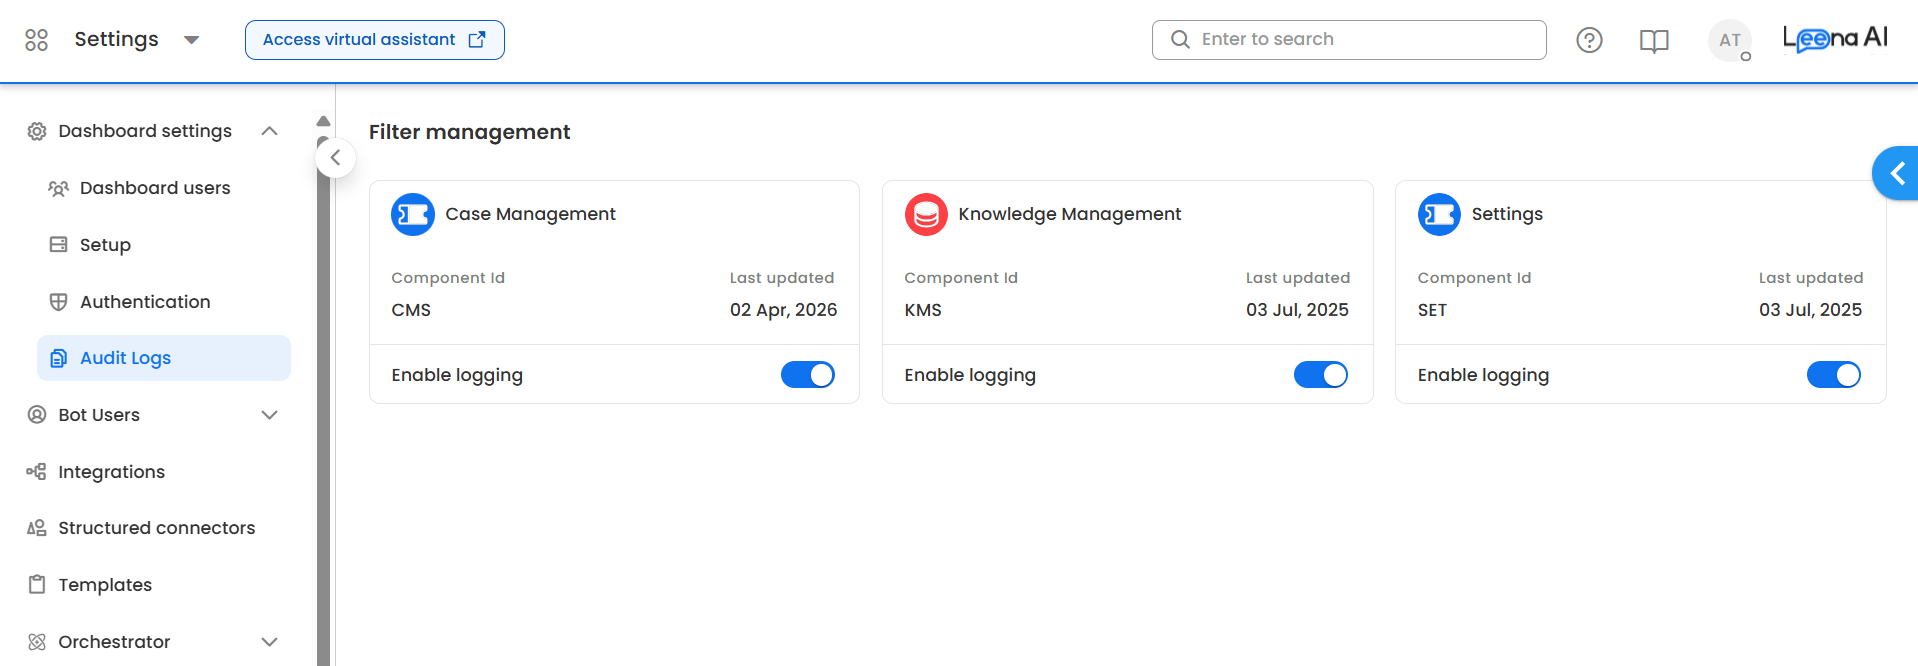
Each module that emits audit events appears as its own card:
| Element | What it shows |
|---|---|
| Component ID | The short identifier used to scope events in Explorer — for example CMS, KMS, SET, ONBOARDING |
| Last updated | When the capture configuration was last saved |
| Enable logging | Turns capture on or off for that module, independently of the others |
Clicking a card opens its detail page, where you choose which activities to log and apply additional criteria.
Choosing activities
Each module lists its activities as checkboxes, with an All events option at the top to select or clear them together.
The activity list is fetched when the page opens, so newly added platform events become selectable automatically — there's no manual refresh of the configuration.
Modules that emit audit logs
Case Management
Configuration changes to the Helpdesk admin setup. The actor's IP address, user agent, and a redirection link to the affected configuration page are recorded with every event.
| Area | Activities (create / update unless noted) |
|---|---|
| User Groups | Create user group, Update user group |
| Departments | Create department, Update department |
| Categories | Create category, Update category |
| SLA Policies | Create SLA policy, Update SLA policy |
| Schemas | Ticket schema, Priority schema, Status schema |
| Email configuration, Email automation, Email settings update | |
| Forms & Content | Ticket form, Canned response |
| System | Report configuration, Localization, General settings update |
All of these are emitted at Medium priority.
Knowledge Management
The article lifecycle, connector activity, and KM-level setting changes.
Article lifecycle
| Activity | Priority |
|---|---|
| Article created | Medium |
| Article sent for review | Medium |
| Article published | High |
| Article rejected | High |
| Article archived | High |
| Article restored | High |
| Article downloaded | Medium |
| Article acknowledgment / notification sent | Medium |
| Article expiry date updated | High |
| Article publish date updated | High |
| Article access updated (owners, collaborators) | Medium |
| Article rating configuration updated | Medium |
Connectors and sync
| Activity | Priority |
|---|---|
| Connector connected | High |
| Connector disconnected | High |
| Manual connector sync triggered | High |
| Auto-sync toggle / frequency changed | High |
KM settings
| Activity | Priority |
|---|---|
| Approval matrix created | Medium |
| Approval matrix updated | Medium |
| Audience created | Medium |
| Audience updated | High |
| Tag created | Low |
| Tag updated | Medium |
| Dashboard setting — global article owner, publish, download, expiry | Medium |
| Bot setting — AI configuration updated | High |
| Bot setting — Language updated | High |
| Folder access updated | Medium |
Global Settings
The dashboard-user lifecycle and access events.
| Activity | Priority |
|---|---|
| User login | Low |
| User created | Medium |
| Password changed | High |
| Profile updated | High |
| Role changed | High |
| User deactivated | Critical |
| User reactivated | Critical |
These are the events an access review is built on. Note that User login is Low priority — so a priority filter set to Medium or above silently excludes login history, which is usually the first thing an auditor asks for.
Onboarding
The candidate journey, form activity, task execution, and onboarding configuration changes.
The component ID resolves to either ONBOARDING or OFFBOARDING depending on the bot's onboarding setting, so this may appear as two separate cards.
Candidate lifecycle
| Activity | Priority |
|---|---|
| Candidate added (single) | Medium |
| Candidate added (bulk) | Medium |
| Candidate onboarded | High |
| Candidate onboarding stopped | High |
| Candidate onboarding reinitiated | Medium |
| Candidate profile updated | Medium |
Forms
| Activity | Priority |
|---|---|
| Form updated by candidate | Medium |
| Form approved | Medium |
| Form sent for resubmission | Medium |
| Form status updated | Medium |
Tasks and triggers
| Activity | Priority |
|---|---|
| Task trigger in progress | Medium |
| Task trigger completed | Medium |
| Task status updated | Medium |
| Action trigger succeeded | Medium |
| Action trigger failed | Medium |
Configuration
| Activity | Priority |
|---|---|
| Onboarding setting added | Medium |
| Onboarding setting updated | Medium |
| User permissions updated | Medium |
| Table filters updated | Medium |
Additional criteria
The Additional criteria to be recorded for the above events panel fine-tunes capture behaviour.
Every criterion is opt-in, and leaving one unchecked means no constraint — leaving Priority unchecked captures events of all priorities rather than none.
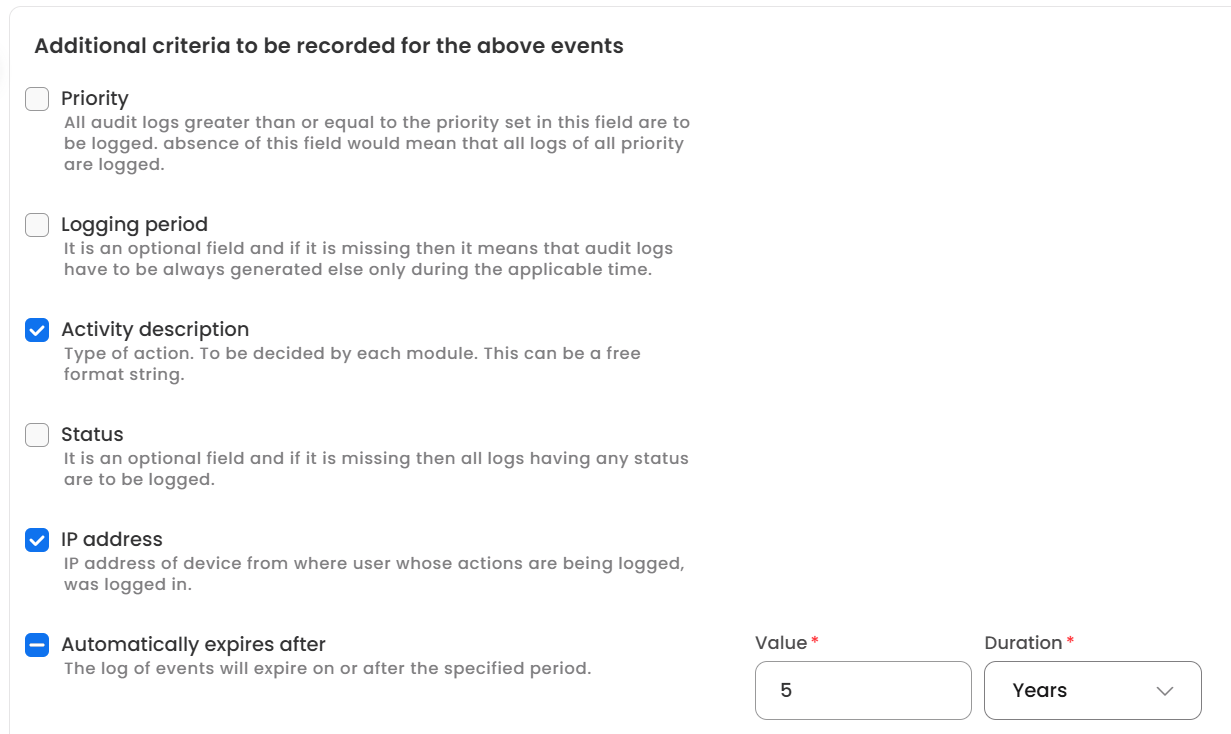
| Criterion | What it does |
|---|---|
| Priority | Captures only events at or above the selected level. Options are Critical, High, Medium, Low |
| Logging period | A start and end date bounding when capture is active. Outside the window, nothing is recorded for the module. Suits time-boxed audits and pilots |
| Activity description | Captures a human-readable description of the action alongside each event. Each module decides what it puts here |
| Status | Captures only events with the chosen outcome — Success, Failed, or In-progress |
| IP address | Captures the IP address of the device the action came from |
| Automatically expires after | The retention period for captured logs, as a number plus a unit of Days, Weeks, Months, or Years |
Activity description and IP address are on by default, giving reviewers the minimum context to reconstruct who did what. Keep Activity description on — without it, reviewers are interpreting raw event-type codes.
Turn the remaining criteria on only when you need to narrow capture or apply a retention policy.
Retention is capped, and the cap is enforced on saveThe maximum retention period is set for your workspace, and an expiry beyond it is rejected with the permitted maximum shown in the error.
Set retention deliberately rather than to the maximum. Audit logs accumulate personal data — names, emails, IP addresses — and keeping them longer than your retention policy allows creates its own compliance exposure.
Status is the criterion most useful during an incident: enabling it with Failed selected narrows capture to what went wrong, without the successful actions burying it.
Programmatic access
An external API is available for pulling audit logs into your own SIEM or compliance tooling, which suits continuous monitoring better than periodic manual exports. See Audit Logs External API.
Updated about 2 months ago