Reports/Analytics
Watch the tutorial
Who can view reports?
A dashboard user who has workflows admin permission could view the reports section under Workflows product/segment.
What kind of reports do we show?
- All Apps: It allows admin to view requests raised for each kind of workflow
- User level Reports: It allows admin to view requests raised by each user in the Organization.
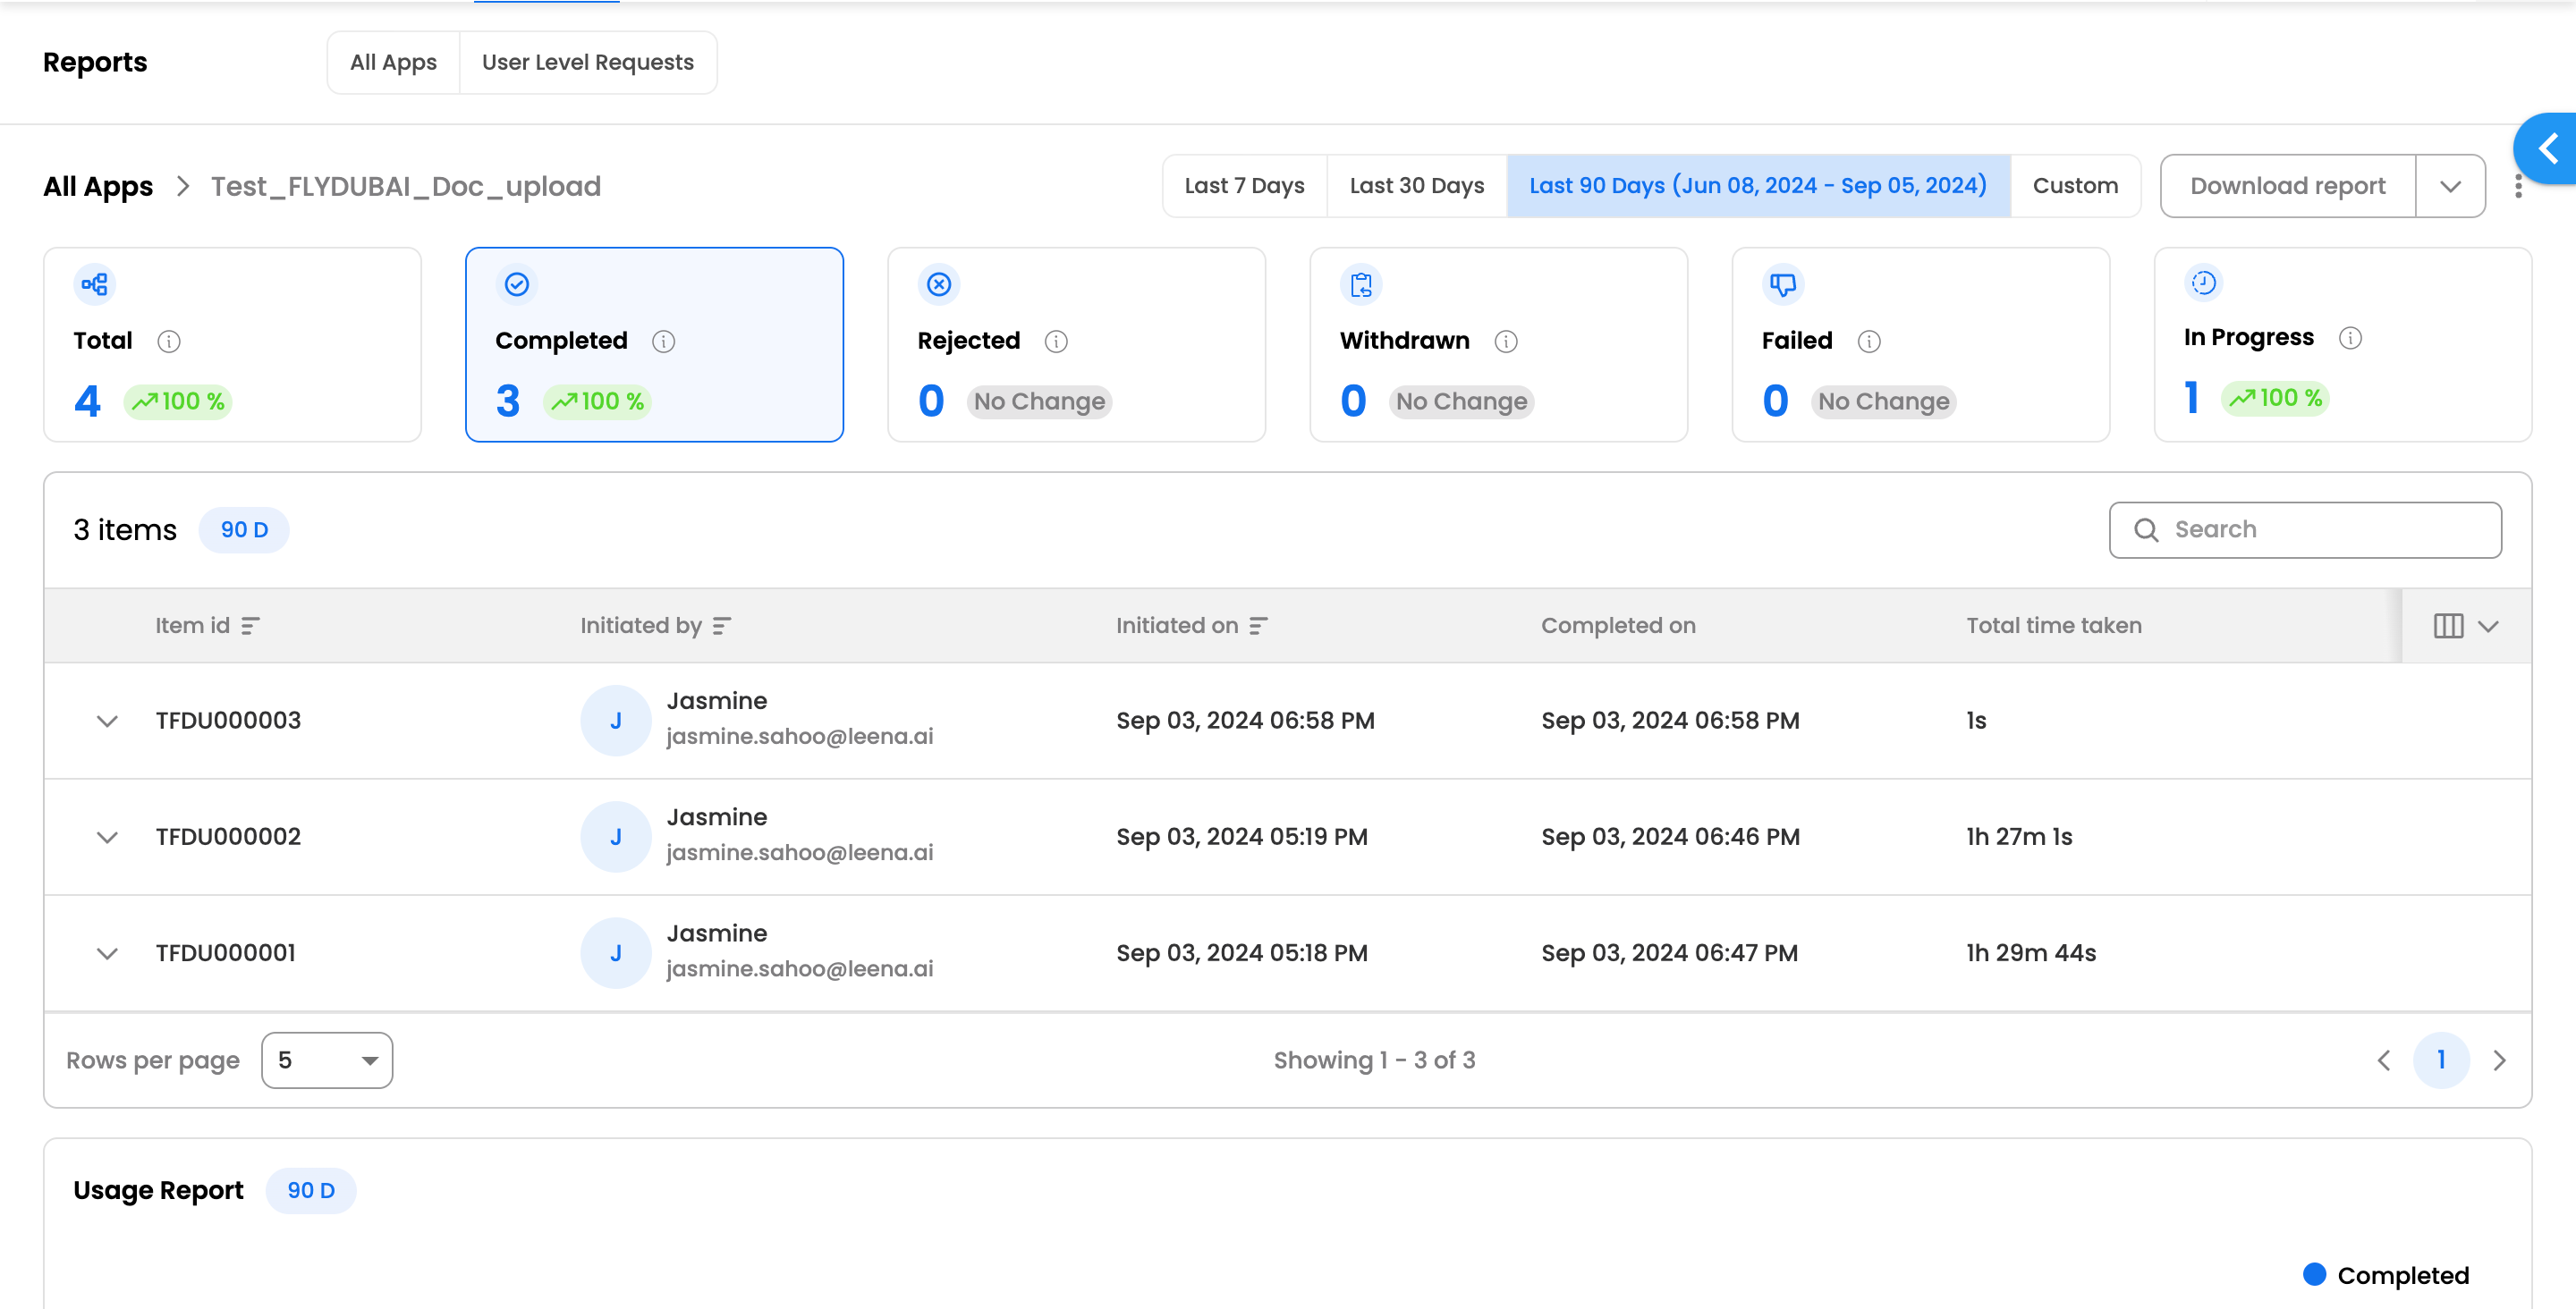
All Apps
Drill-down to view additional details under ‘All Apps’
- A user can click on a particular count next to an App for a status to view the details.
- The Drill down view shows the different requests for the same app, under the selected status
- A user can drill down and view the app specific requests for the statuses:
-
Successful/Completed
-
Rejected
-
Withdrawn
-
Failed
-
In Progress
-
Total (Cumulative of all the above specified statuses)
-
Selecting Date range
- A user can select a date range of preference to view the requests raised within that particular date range. Which means, that a request would reflect under the selected date range, if its Initiated at/Requested at time stamp falls within this range.
- The predefined date ranges supported are Last 7 days, Last 30 days & Last 90 days.
- A user can also select a custom date range, which does not have any limitation on start and end date for a date range.
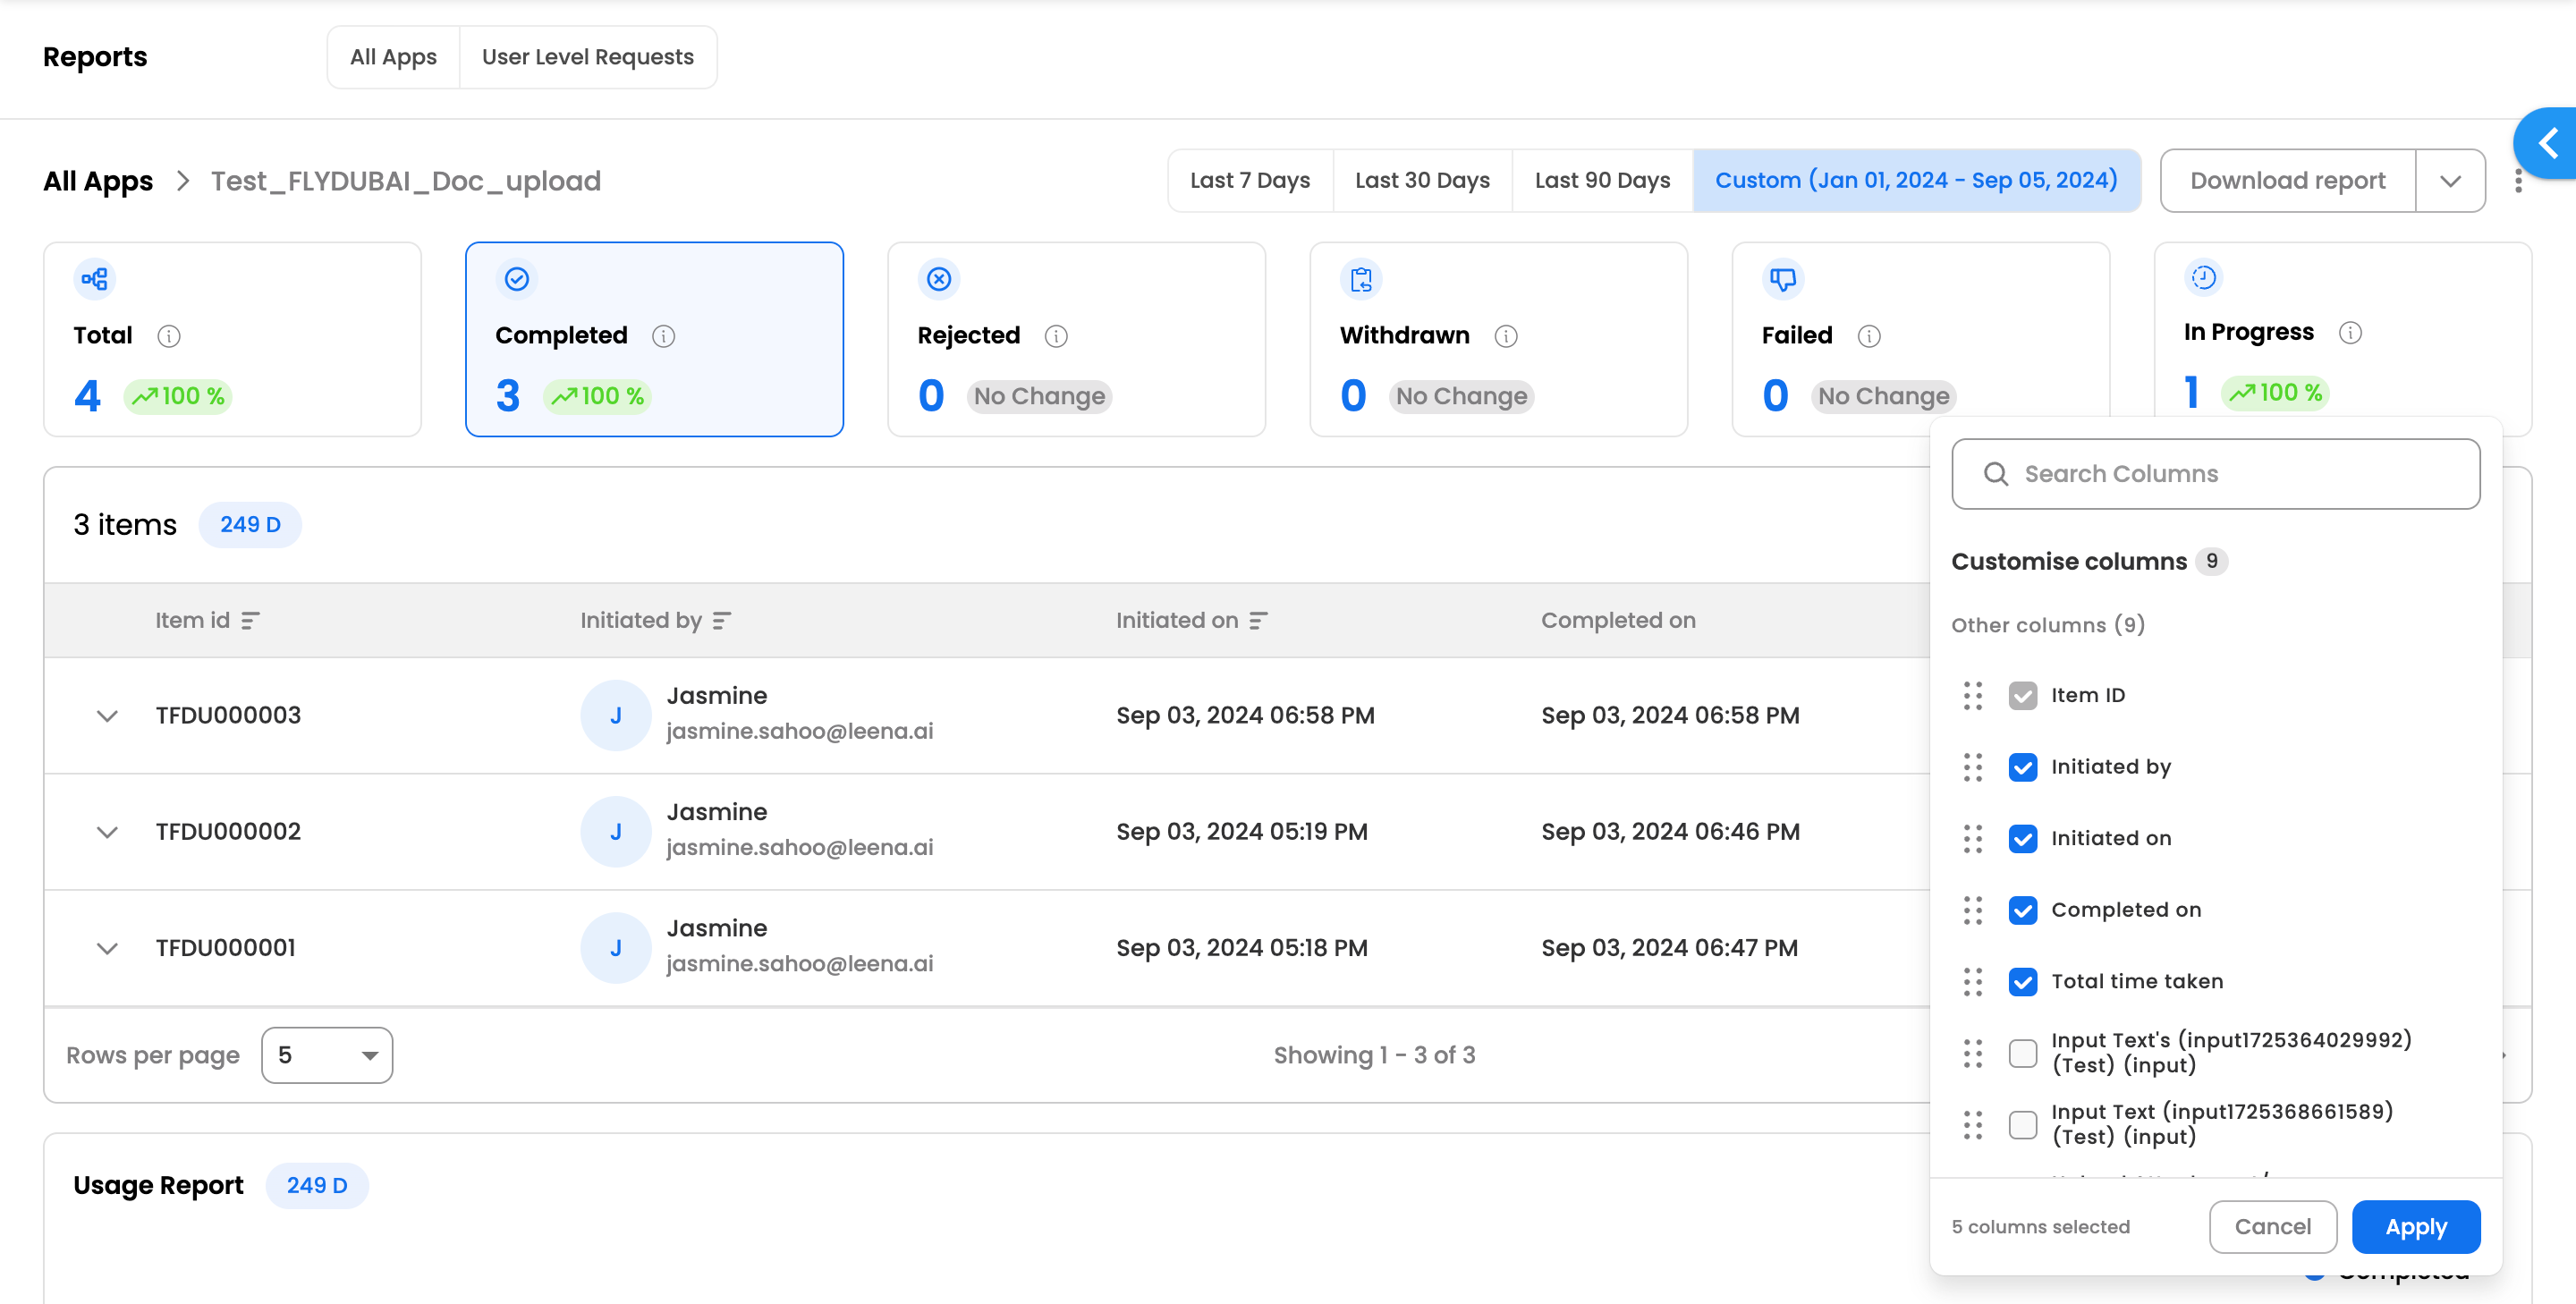
Manage Columns
-
The dashboard user/viewer can choose which columns to view under the table view of requests.
-
The manage Column option allows user to view the default columns & all the form fields associated with a particular application.
-
The user can view a particular field under the dropdown in the following format: (Label of the field)(Field ID)(Associated form in which the app is created)(Type of the field)
-
The current state of the selected columns is stored against a user profile
Reports Export
- A user can export the requests' listing in CSV
- Which means, that if a user is viewing a list of columns & requests in the table, these would be exported in CSV.
- There are 2 types of reports which can be exported:
- Summary Report
- The user can export all the columns which are part of the table, including default columns
- Summary & Form data Report
- The user can export a summary report along with each forms' report which is part of the application.
- Summary Report
- The reports are downloaded on the desktop itself, as well as, sent on email of the requester
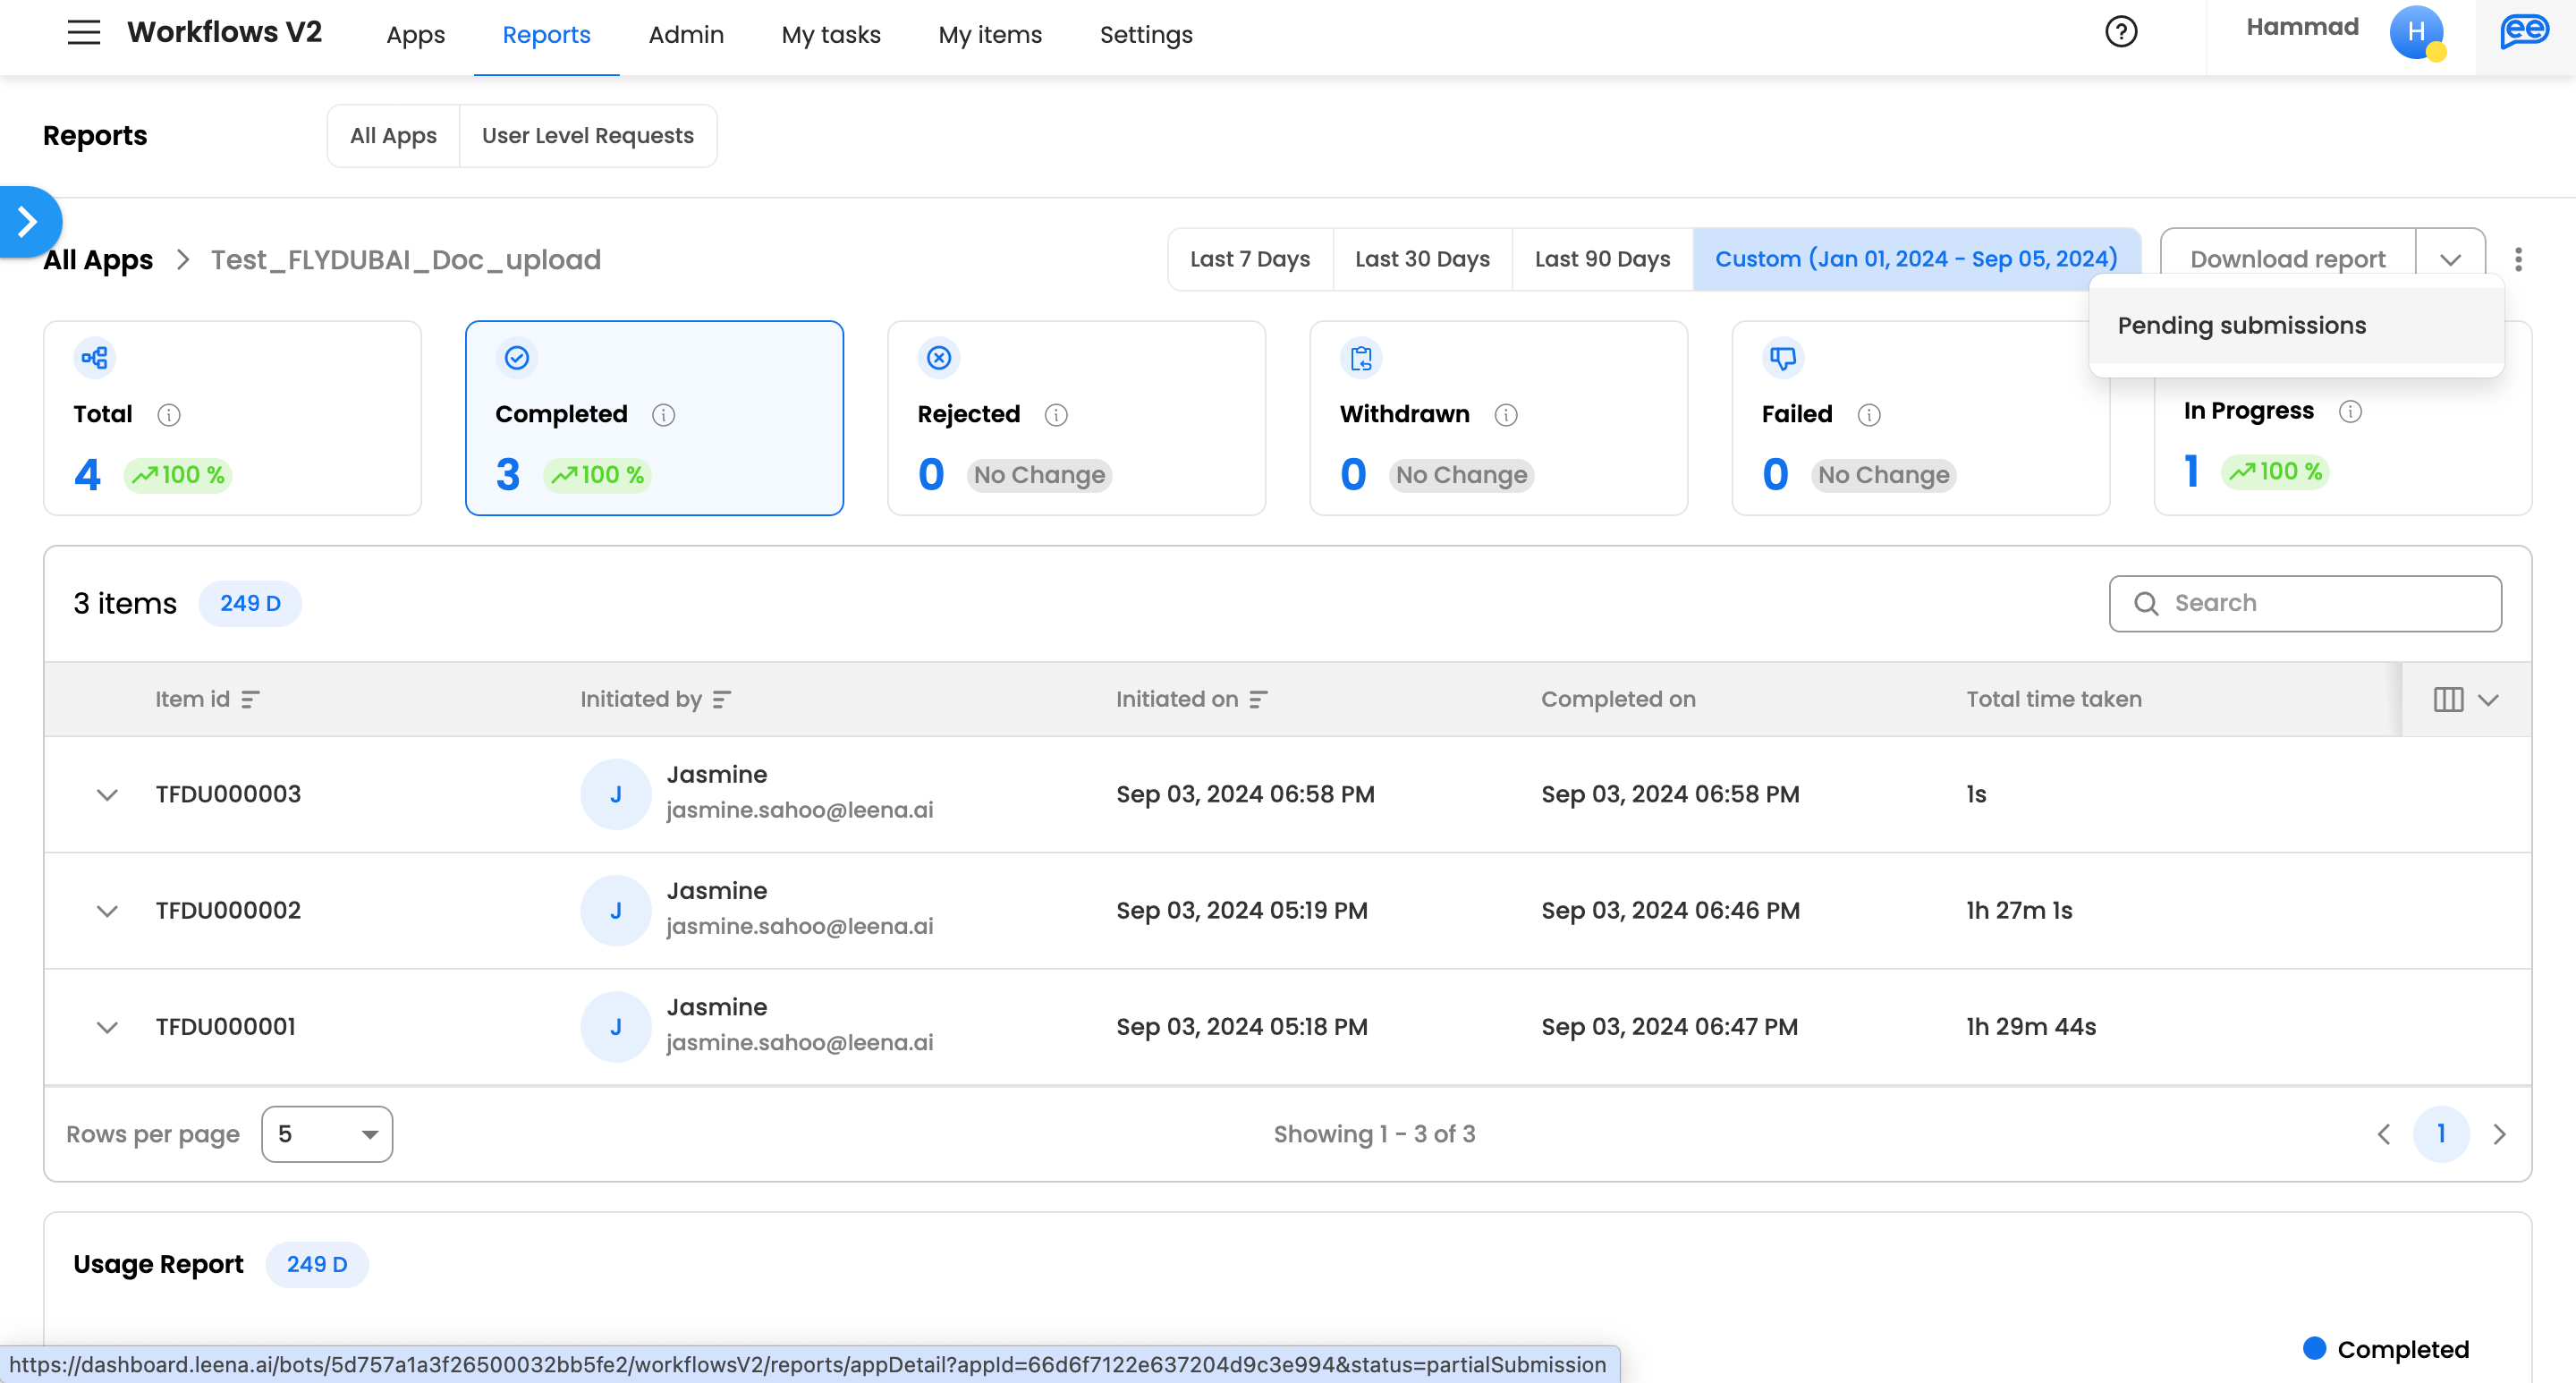
Pending Submissions
-
While raising a request, if the user’s attempt to submit request fails, or user just saves the request in draft, we categorise those requests under ‘Pending Submissions’
-
For each application, an admin can view ‘Pending Submissions’ by clicking on CTA next to Download Reports.
-
Under Pending submissions, the user gets the same view as that of other statuses, with option to view the different requests under pending submissions, and expanding to view the details
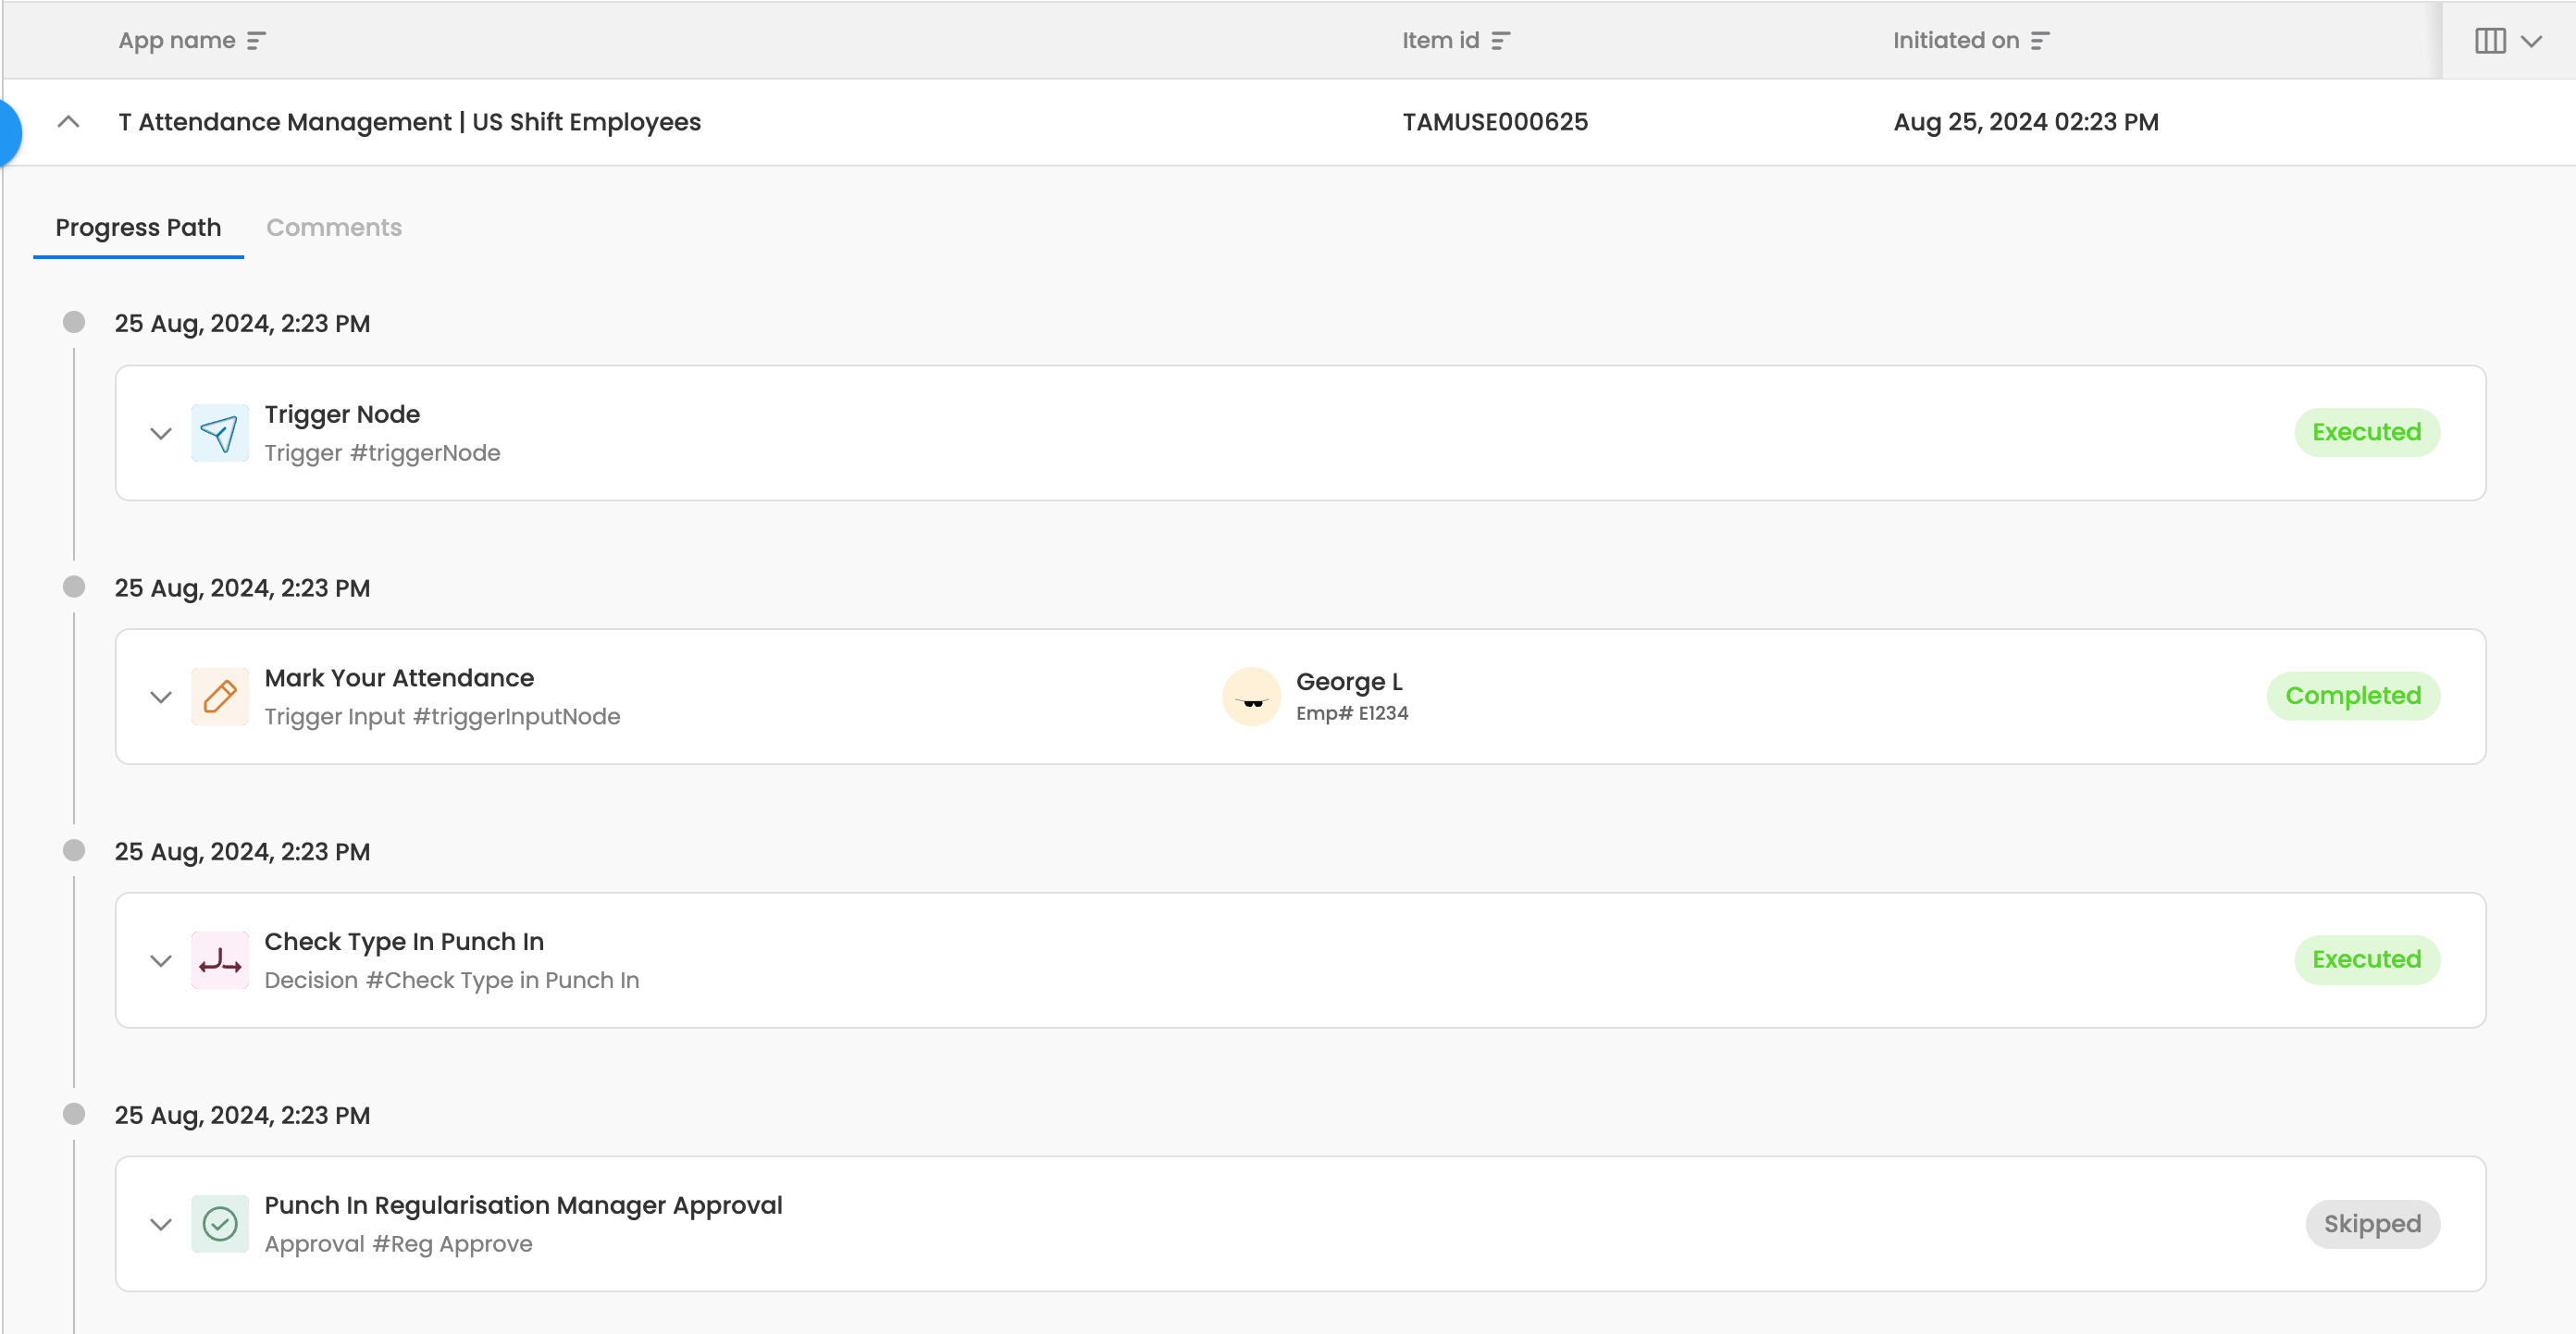
View Entire Audit log/Progress path for a particular request
- A user can click on accordion to expand a particular request.
- A user can view the following details after expanding a particular request for each node:
| Node/Step Type | Details | Description |
|---|---|---|
| Start Node |
| This is the first initiation step for the request, which allows the user to submit request |
| Approval Node |
| Entire details related to approval node is captured which shows the admin when the approval step was assigned, when it was completed & by which user, what details were submitted by the user |
| Input Node |
| Entire details related to input node is captured which shows the admin when the input step was assigned, when it was completed & by which user, what details were submitted by the user |
| Action/Function Node |
| The overview of these nodes allows user to view what was the request body sent for a particular API call/action or Javascript function executed. It also highlights what was the response body & and what response keys where mapped to form fields. |

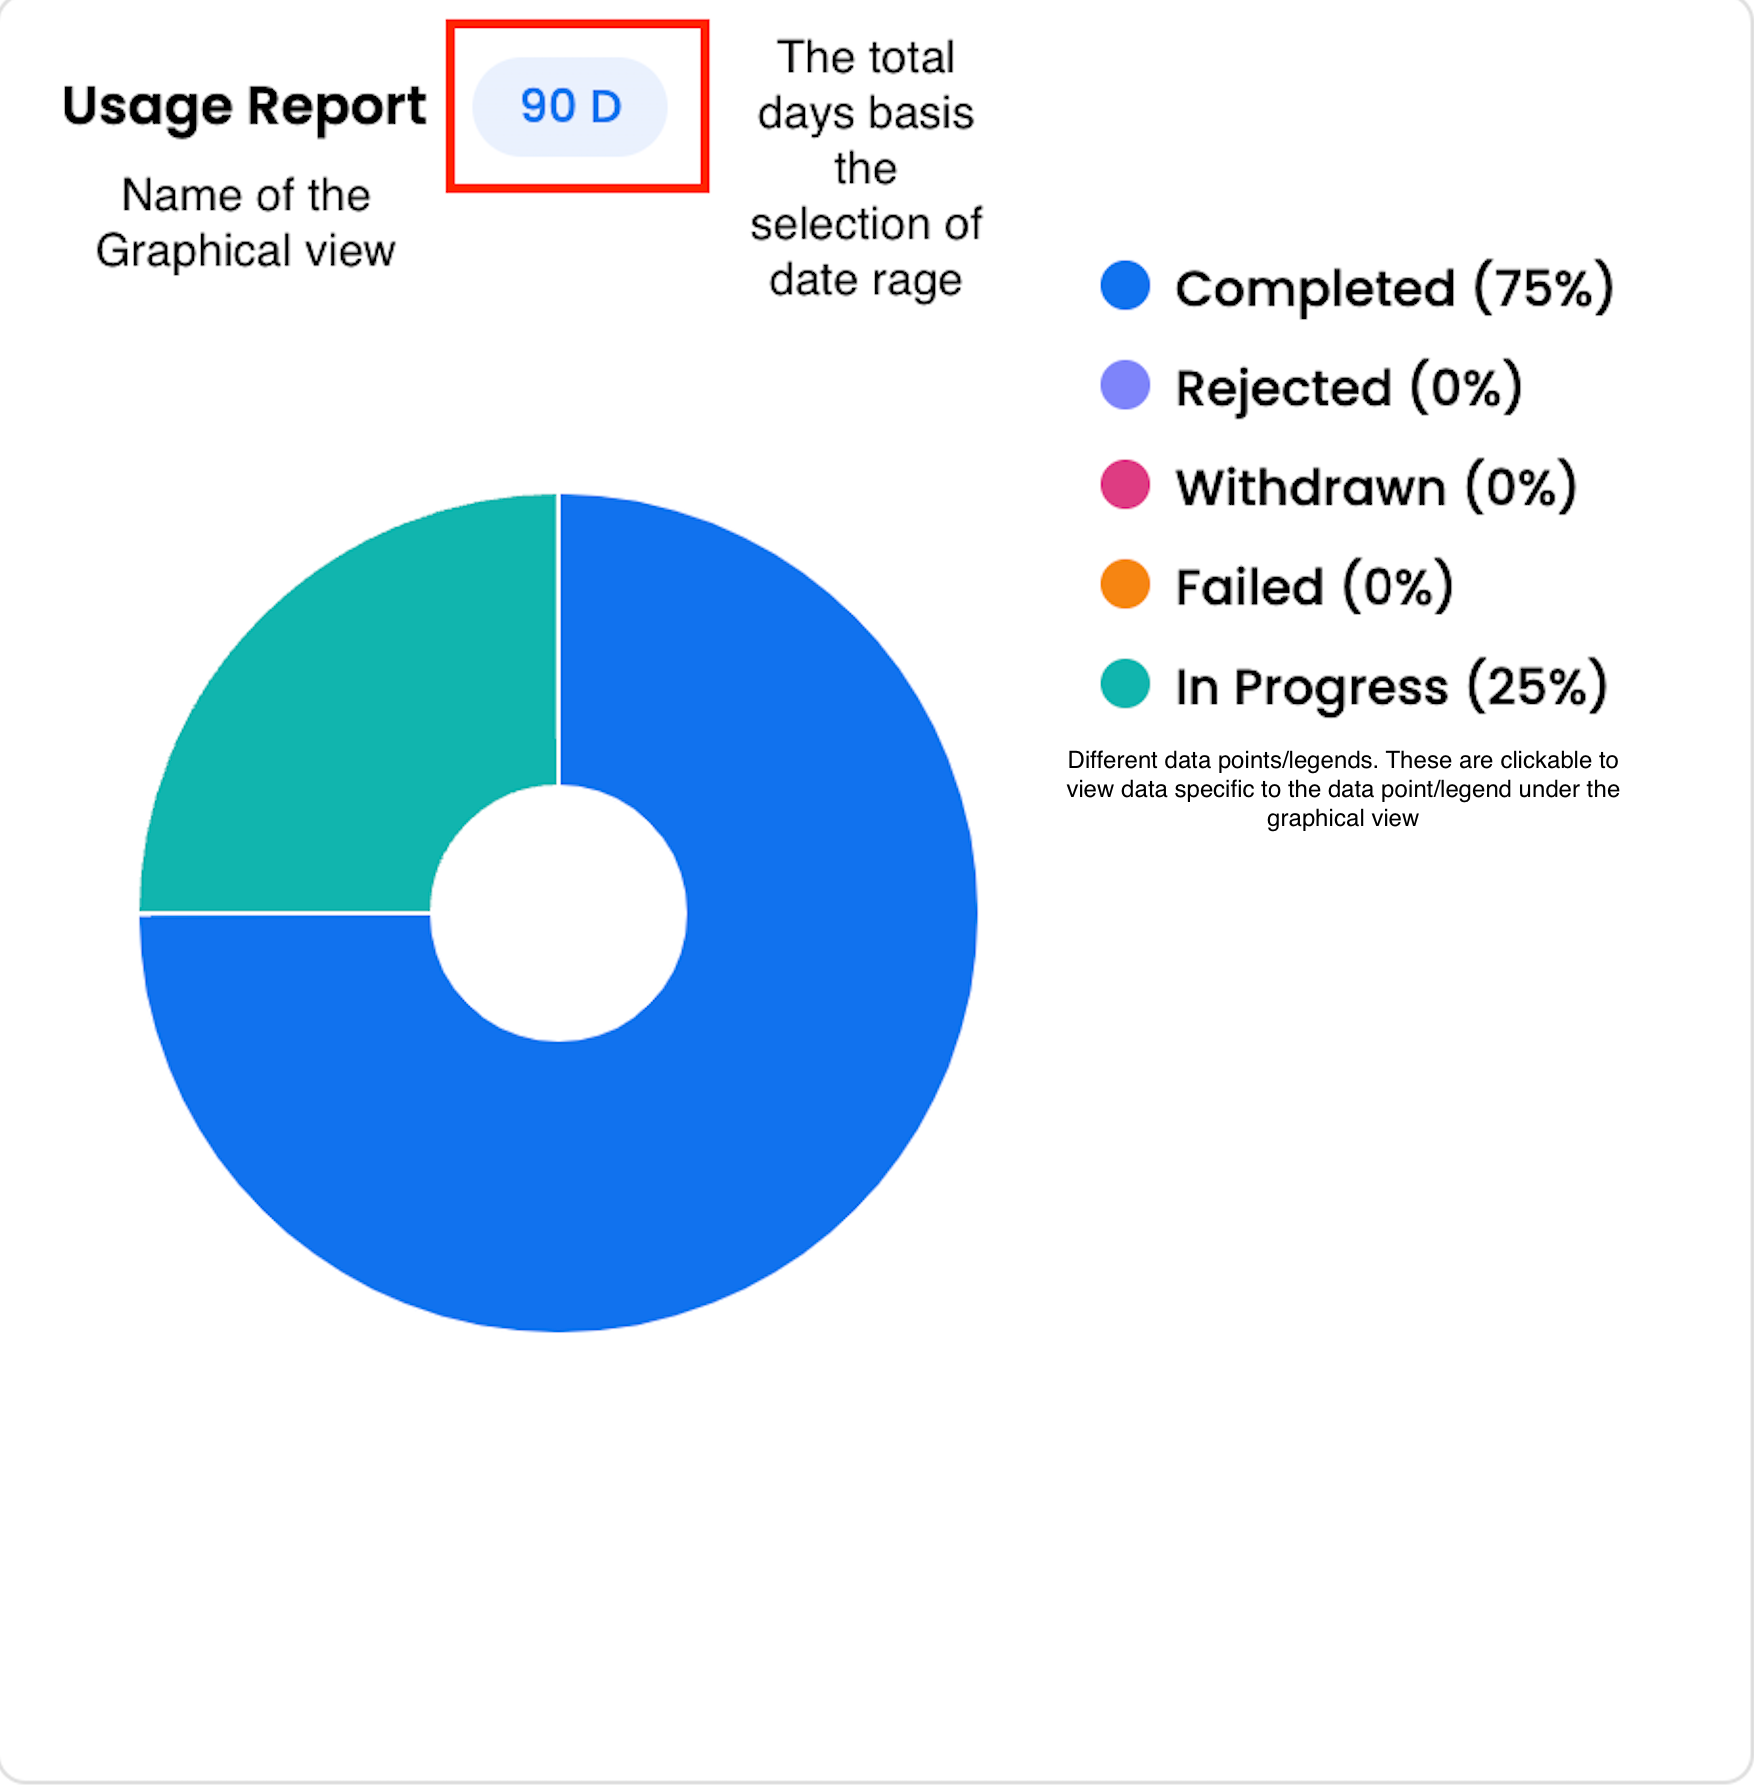
Graphical View
- For each of the application specific statuses, we provide different graphical views
- The timeline for these graphical views changes as per the select date range/timeline
- Following are the different views which are provided for different statuses of an application, and its calculation/interpretation:
| Status | View | Interpretation |
|---|---|---|
| Total | Usage Report (graph) | This report gives us a status wise count of requests which were raised on which particular date within the selected date range |
| Usage Report (pie chart) | This representation gives us the %age split between the total count of requests under different statuses | |
| Time Taken Insights |
| |
| Time Taken Report | This report shows us Minimum Time, Maximum Time & Average Time taken for completion of requests as per Initiated at date | |
| Successful | Usage Report (graph) | This report gives us count of requests initiated at each date within the selected date range. This report only shows this data for successful requests |
| Time Taken Insights |
| |
| Time Taken Report | This report shows us Minimum Time, Maximum Time & Average Time taken for completion of requests as per Initiated at date | |
| In Progress | Usage Report (graph) | This report gives us count of requests initiated at each date within the selected date range. This report only shows this data for In Progress requests |
| Failed | Usage Report (graph) | This report gives us count of requests initiated at each date within the selected date range. This report only shows this data for failed requests |
| Time Taken Insights |
| |
| Time Taken Report | This report shows us Minimum Time, Maximum Time & Average Time taken for completion of requests as per Initiated at date | |
| Withdrawn | Usage Report (graph) | This report gives us count of requests initiated at each date within the selected date range. This report only shows this data for Withdrawn requests |
| Time Taken Insights |
| |
| Time Taken Report | This report shows us Minimum Time, Maximum Time & Average Time taken for completion of requests as per Initiated at date | |
| Rejected | Usage Report (graph) | This report gives us count of requests initiated at each date within the selected date range. This report only shows this data for Rejected requests |
| Time Taken Insights |
| |
| Time Taken Report | This report shows us Minimum Time, Maximum Time & Average Time taken for completion of requests as per Initiated at date |
Different touch points within a graph
User level Requests
'User level Requests' view allows the admin to view the requests raised by each user within the Organization.
Drill-down to view additional details under ‘User level Requests’
- A user can click on a particular count next to a user to view the details for each of the statuses
- The Drill down view shows the different requests raised by the same requester, under the selected status
- The drill down view shows requests across different applications.
- A user can drill down and view user specific requests for the statuses:
-
Successful/Completed
-
Rejected
-
Withdrawn
-
Failed
-
In Progress
-
Total (Cumulative of all the above specified statuses)
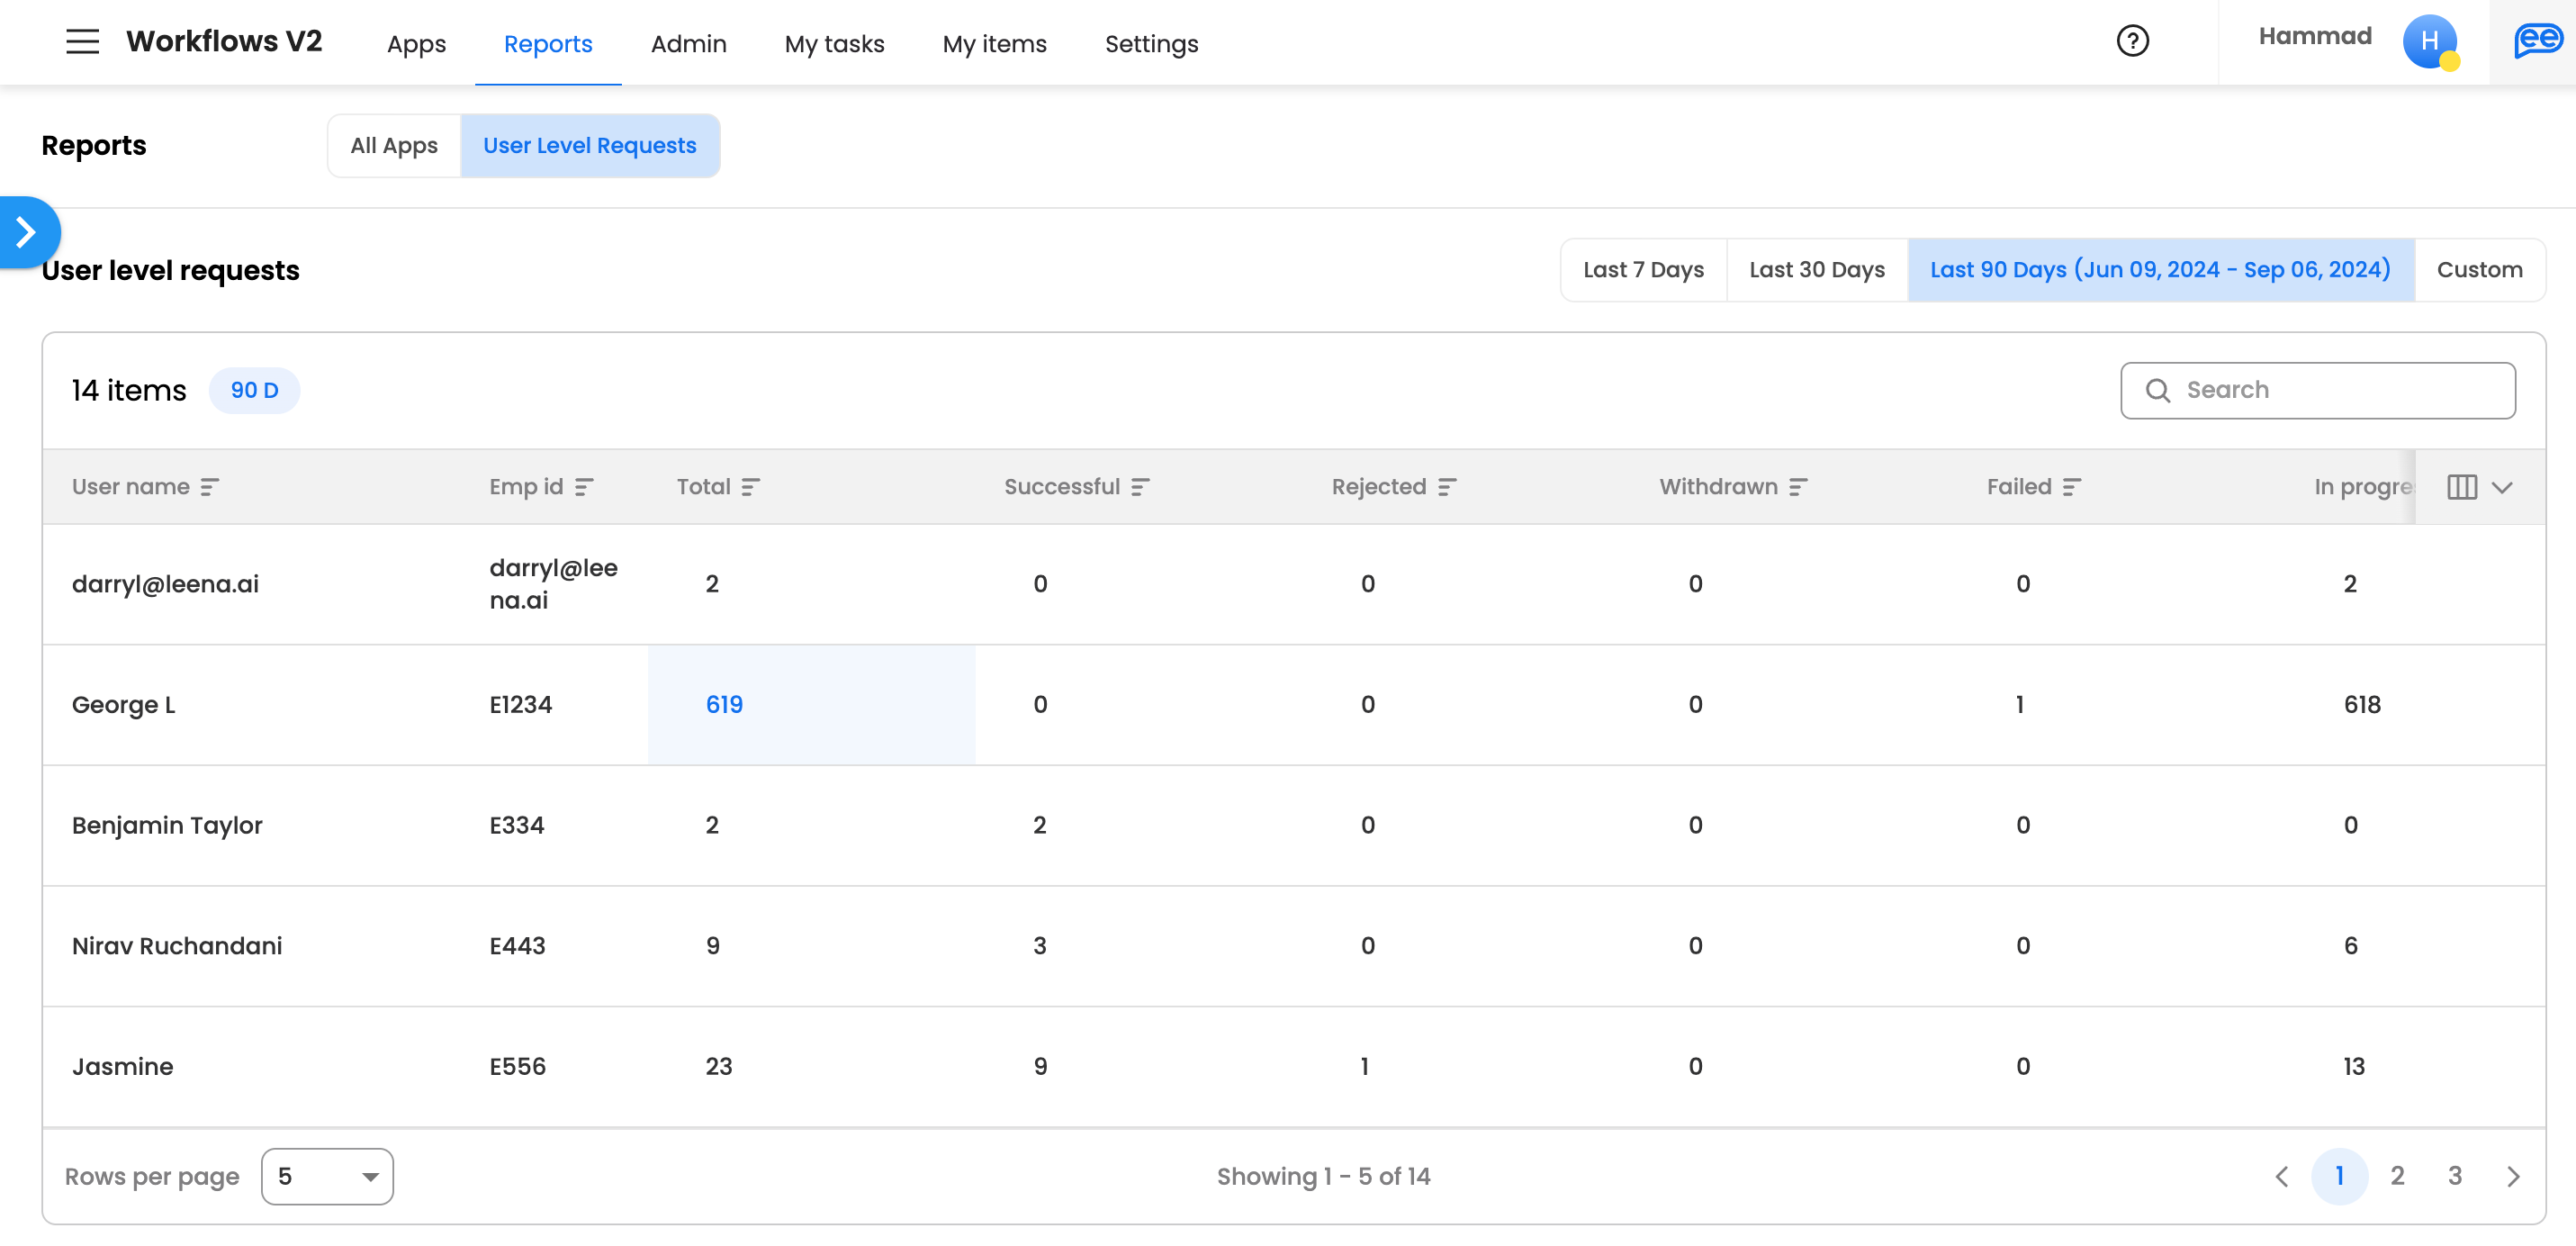
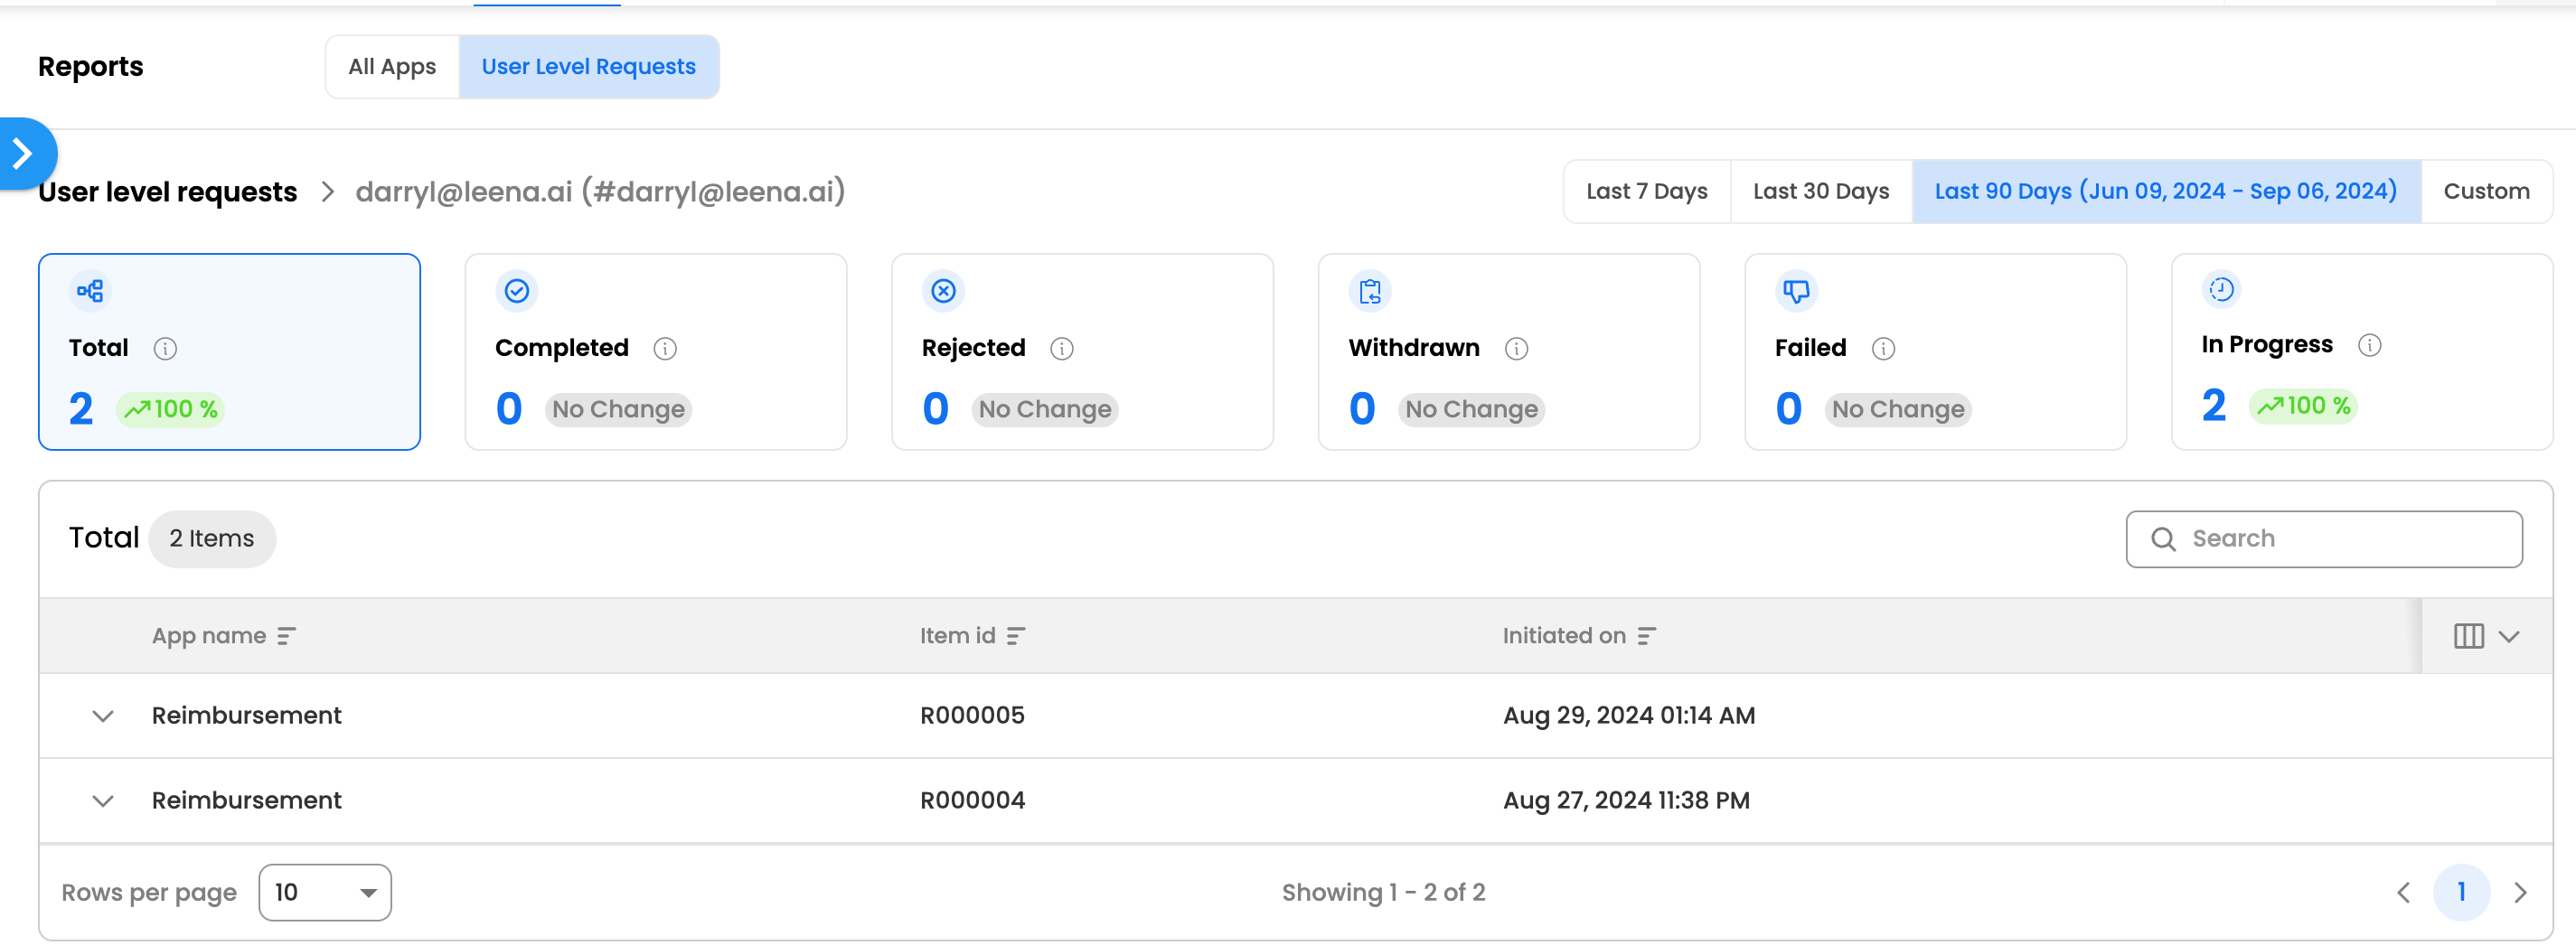
-
View Entire Audit log/Progress path for a particular request
- A user can click on accordion to expand a particular request.
- A user can view the following details after expanding a particular request for each node:
| Node/Step Type | Details | Description |
|---|---|---|
| Start Node |
| This is the first initiation step for the request, which allows the user to submit request |
| Approval Node |
| Entire details related to approval node is captured which shows the admin when the approval step was assigned, when it was completed & by which user, what details were submitted by the user |
| Input Node |
| Entire details related to input node is captured which shows the admin when the input step was assigned, when it was completed & by which user, what details were submitted by the user |
| Action/Function Node |
| The overview of these nodes allows user to view what was the request body sent for a particular API call/action or Javascript function executed. It also highlights what was the response body & and what response keys where mapped to form fields. |