
CM Performance
Performance Metrics
The dashboard focuses on how quickly and efficiently tickets are getting resolved (or not) based on the defined SLAs. It helps admins drill down into the issues that cause delays in resolutions and gaps within established processes.
- The first performance metric we will be tracking is the ticket resolution percentage. Here, we will be able to see the resolved tickets with a bifurcation between directly resolved and reopened & resolved tickets for both old and new tickets in the time range.
Possible validation check: Total resolved tickets in the timeframe will be the sum of the resolved tickets (without reopening) and reopened & resolved tickets in the timeframe.
- Tickets rated is a direct metric. It gives the total number of tickets rated at any point in time post-closure. This can include periods after the selected duration. The average rating per ticket metric calculates the total rating provided divided by the number of tickets rated. The unrated tickets will not be considered for the average ticket rating calculation.
- Average first response time calculates the average time taken by agents to make a first response. It is calculated as the sum of the first response times for the active tickets in the selected time range divided by the total number of first responses. There are two points to note here. Firstly, tickets that have no response will not be included in the calculation of this metric. So even if there are a lot of tickets that don’t have a single response it is possible to have an overall low average first response time as the agents could have responded quickly to a set of tickets while not responding at all to a set of tickets. Secondly, the denominator includes all first responses. This means that when a ticket is reopened the time it takes for the first response (after reopening) is included and this first response is also counted as a unique first response. So, it is possible to have more first responses than the actual number of tickets with a first response. This metric is further bifurcated into two additional metrics-
- for resolved tickets
- for unresolved tickets
Analysts will be able to see the difference between how quickly agents respond to tickets that are ultimately closed or remain unresolved.
- The average response time for resolved tickets calculates the average response time (not just the first response) for only the closed tickets as of the end of the selected period.
Resolution Time Insights
Under the Resolution Time Insights section, the analysis will focus on resolved tickets. The average time spent on each status shows the time spent on Open, Acknowledged, and Blocked status types.
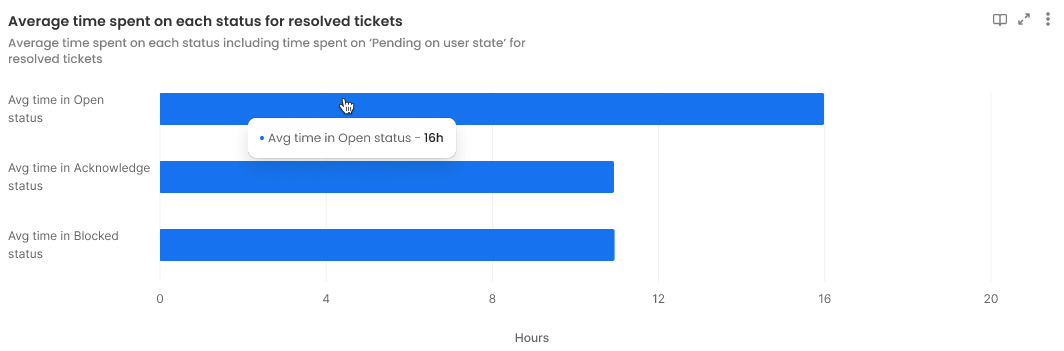
In the new CM, we allow the creation of multiple status values on each status type. In this scenario, on clicking any of these bars, users will be able to drill down into the time spent on each of the status values. For example if you click on Acknowledge status, you will be able to drill down into each of the acknowledged status values.
- Average Idle time - Idle time is the total time spent on a ticket outside the purview of an agent. It is the total time spent in blocked status or pending on the user. The average idle time therefore calculates the total idle time per ticket.
Please note that “Blocked” is a status and “Pending on user” is a state. That is, a ticket can have any status while it is ‘pending on user'. Overall, when a ticket is pending on the user or when it is blocked the agent has no control over the ticket. Hence, we are defining this time as idle.
Possible validation check: idle time = time in blocked status + 'Pending on user’ state in open status + 'Pending on user’ state in acknowledged status
- Average Resolution time - The resolution time is the total time spent on a ticket from creation to closure without including the idle time. The average resolution time, therefore, calculates the total time per ticket.
In case a ticket is reopened, the time it was in closed status will not be included. - Average Closure time - This is the total time spent on a ticket from creation to closure. This includes the idle time. If a ticket is reopened this will exclude the time it was in closed status.
Resolved within SLA gives the percentage of tickets that were resolved within the SLAs defined. This will also account for different SLA definitions for different types of tickets. One comment resolution gives the percentage of tickets that were resolved with the first response from the agent. Please note that the default response won’t be considered for this metric.
Engagement Metrics
Engagement metrics focus on how actively involved the ticket stakeholders are for the ticket. These metrics should be low as cases need lesser engagement and faster resolution.
Tickets with at least one comment show tickets with at least one comment excluding the default acknowledgement comment. Additionally, we also capture the following metrics-
- Average no. of Agent comments per ticket
- Average no. of Creator comments per ticket
- Percentage of tickets with first response made within SLA
- Percentage of tickets with all responses made within SLA
Operational Metrics
Operational metrics focus on the different actions taken on tickets.
The number of tickets forwarded shows a count of the tickets that were forwarded at least once. This does not capture the total number of forwards. The objective of this metric is to give an idea of how many tickets need another stakeholder intervention for ticket resolution. The more the forwards, the more the stakeholders who are getting involved in the ticket resolution. However, there can be scenarios where forwards cannot be avoided. So this metric cannot be viewed in isolation.
Likewise, the number of tickets reassigned gives an idea of the number of tickets wrongly assigned based on the existing SLA logic. A higher percentage could indicate a need for a recheck of the assignment logic.
In certain scenarios (like Email ticketing) categories and subcategories are assigned based on the issue description. So the Number of Tickets with category/subcategory updation metric can indicate how effectively this mapping happens.
Resolved and Unresolved Ticket Analysis
In unresolved tickets analysis, there are two dropdowns- Unresolved responded tickets (with at least one agent response) and unresolved unresponded tickets (with no agent responses). For each of these categories, we will be able to see the distribution of tickets by their ages. We will also be able to see the SLA levels of these tickets.
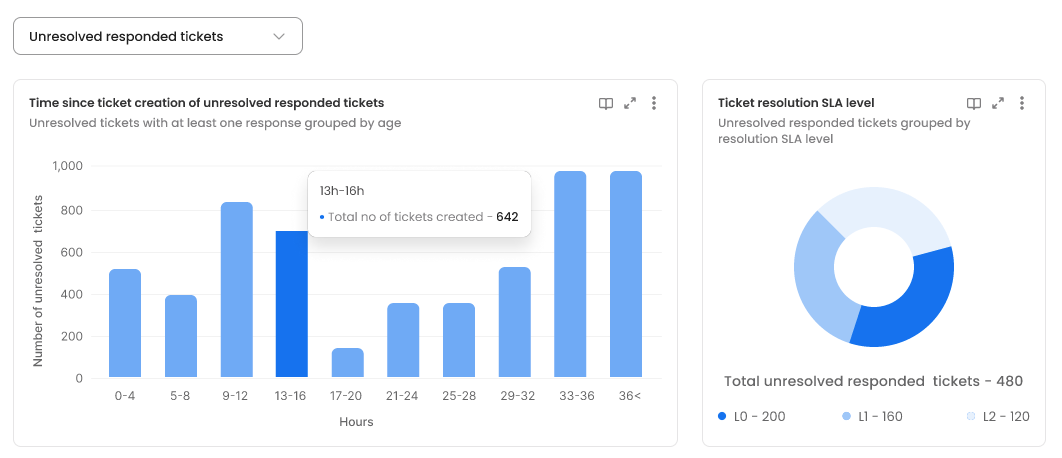
This will give an idea of the number of priority tickets that need immediate attention (tickets with higher age and high escalation levels).
The same age and SLA distribution is available for resolved tickets.
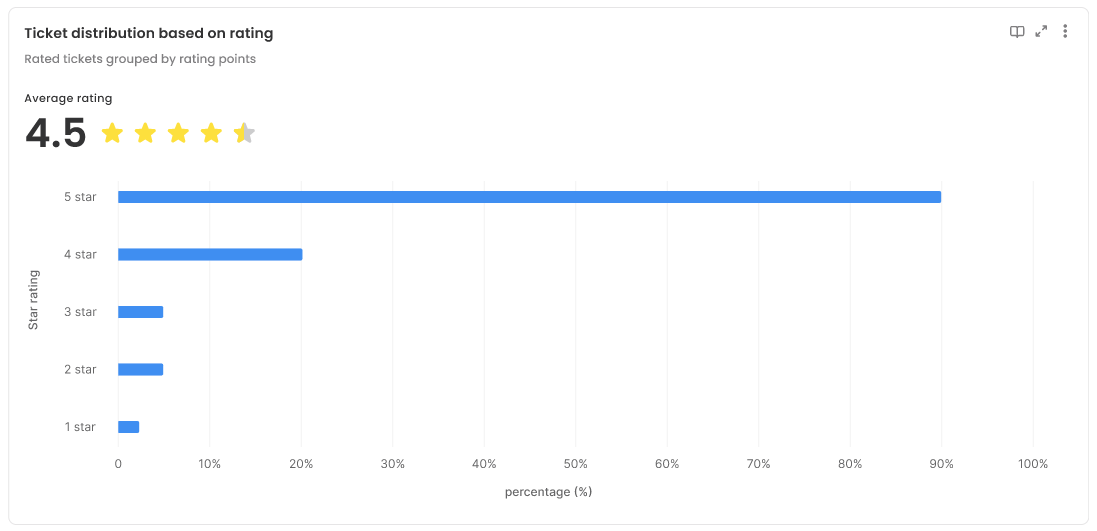
Rating Analysis
Lastly, we have the rating analysis. Here, we will be able to see the distribution of tickets based on the rating. Please note that only rated tickets will contribute to the average rating.
Attribute-wise Ticket Overview and Performance
Lastly, we have an attribute-wise ticket overview and attribute-wise ticket performance analysis. Here, based on each attribute (like for eg., category, priority, channel, etc). For each value of the attribute, we will be able to see the distribution of tickets across different metrics. Please note that a ticket will be attributed to the value of the attribute at the end of the selected period. For eg., if the category of the ticket was initially Salary Issues and was later changed to Tax Issues
Here, we will be analyzing the following metrics as part of the ticket overview -
- Active Tickets - Total number of tickets with the attribute value at the end of the period and unresolved at least once during the selected period.
- New Tickets - Total number of tickets with the attribute value at the end of the period and were created in the selected period.
- Old Tickets - Total number of tickets with the attribute value at the end of the period and were created before the selected period.
There is no fundamental difference in the active, old, and new tickets definition. We are categorizing these tickets based on the attribute values as of the end of the selected period.
- Tickets unresolved (Not reopened) - Total number of tickets with the attribute value at the end of the period and that are unresolved out of the active tickets at the end of the selected period. Here we won't consider tickets that were reopened at least once post-closure.
- Tickets unresolved (reopened) - Total number of tickets that were unresolved post-reopening out of the active tickets at the end of the selected period. Tickets could have been reopened anytime.
- Tickets resolved (Not reopened) - Total number of tickets with the attribute value at the end of the period that was resolved in the selected period. Here we won't consider tickets that were reopened at least once post-closure.
- Tickets resolved (reopened) - Total number of tickets with the attribute value at the end of the period and were resolved post-reopening out of the active tickets during the selected period. It doesn't matter when the ticket was reopened.
As part of performance metrics we have the following, we are tracking-
- Average First Response time - Average first response time of all the tickets with the attribute value at the end of the period. The response should have been made during or before the selected period.
- Tickets First Response SLA levels - Count of tickets with the attribute value at the end of the period grouped by its first response SLA level (Count in L0, L1, L2…)
- Average Response time - Average time taken by agent(s) to make a response for all the resolved tickets with the attribute value at the end of the period. The response should have been made during or before the selected period.
- Tickets Response SLA levels - Count of tickets with the attribute value at the end of the period grouped by its overall response SLA level. The ticket's SLA level will be considered as the highest SLA level among the levels for each response.
- Average Resolution time - Average time taken by the agent to close the ticket for all the resolved tickets in the period with the attribute value at the end of the period. In the case of reopened tickets, the resolution time will be different between closed and reopened times.
- Tickets Resolution SLA levels - Count of tickets with the attribute value at the end of the period grouped by its resolution SLA level
- Number of Tickets Rated - Count of resolved tickets with the attribute value at the end of the period which has a rating. It doesn't matter when the ticket is rated (during or after the period).
- Average Rating - Average rating for all the resolved tickets with the attribute value at the end of the period. It doesn't matter when the ticket is rated (during or after the period).