
Ticket Volume Trend
Total ticket volume
We have three dashboards that will help customers do a deep dive into the nature of tickets raised within the bot, the efficiency in their closure, and the general performance of the handling agents
This dashboard helps analyze the volumetric data of the total active tickets within a time frame. Admins would be able to monitor the distribution of these tickets based on custom and default fields. There is an option to directly download the dashboard level export. This will include all the tickets considered in the individual panels. The export would be a zip file of all the tickets. There are filters that will be applied to the tickets mentioned in the timeframe. Firstly, the date range is selected. By default, the initial selection is “last 30 days”. Users will have the option to choose a custom time range as well. Along with this, users will also have the option to add filters. These filters are applied to the tickets considered as of the end of the selected time range. For eg., If we apply the filter category = Payroll and the time range is Jan 1 2024 to Jan 31 2024, then active tickets with category = Payroll as of Jan 31 2024 will be retrieved. This means tickets that were of a different category but were changed during the time range and finally had category = Payroll as of 31st Jan will also be included.
Below mentioned are the metrics that we will be considering while analyzing the ticket data.
- Active Tickets - All the tickets that were unresolved (i.e., tickets not with a “Closed” status) at any point during the selected period are Active Tickets. Even if a ticket is deleted, if it was not in a “Closed” status in the mentioned period then it will be considered in the analysis
- New Tickets - Tickets that were created in the specified timeframe are new.
- Old Tickets - Tickets that were created before the mentioned time frame are old tickets. Tickets that were created and closed before the time frame will not be considered in the dashboard. However, tickets that were created, closed, and then reopened during the timeframe will be considered as the ticket has been active in the mentioned period.
Possible validation check: Total active tickets will be the sum of new and old tickets. Both new and old tickets can include deleted tickets
- Resolved (not reopened) - Total number of tickets that were resolved in the selected period. Here we won't consider tickets that were reopened at least once post-closure. Resolved tickets can be old or new.
- Reopened & Resolved - Total number of tickets that were resolved post-reopening within the selected period. There is no limit on the number of times a ticket is reopened.
- Reopened & Unresolved - Total number of tickets that were unresolved post-reopening at the end of the selected period.
There is no limit on the number of times a ticket is reopened. Once reopened a ticket will be included as part of the ‘Reopened & resolved’ or ‘Reopened & unresolved’ metrics
Possible validation check: For new tickets, the creation, closure, reopening, and later resolution would have all happened in the specified period. Old tickets could have been reopened before or during the specified period
- Unresolved (not reopened) - Total number of tickets that were unresolved at the end of the time period and were never closed.
Unresolved Ticket Distribution Analysis
Unresolved Tickets - All tickets that are not closed at the end of the selected period are unresolved. Unresolved tickets could be unresolved because they are “pending on user” or because they are “pending on agent”. And these tickets could be tickets that have never been closed or tickets that were closed and reopened. So, we have the four different categories:
-
Pending on Agent (not reopened)
-
Pending on Agent (reopened)
-
Pending on User (not reopened)
-
Pending on User (reopened)
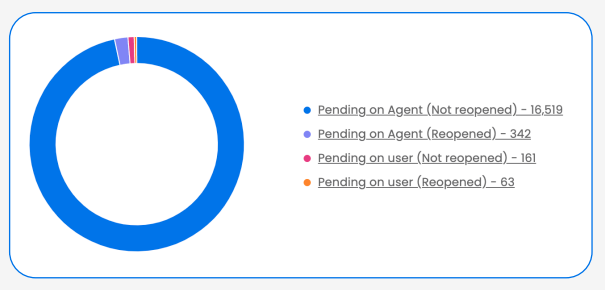
The Unresolved Tickets Distribution section will broadly categorize the tickets within these 4 types. Upon clicking on any of these categories we will be able to see a more granular view of the ticket distribution based on the statuses.
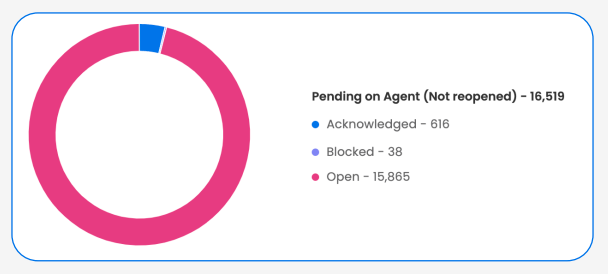
Please note: In the new CM this bifurcation will be extended to the custom statuses defined by the customers.
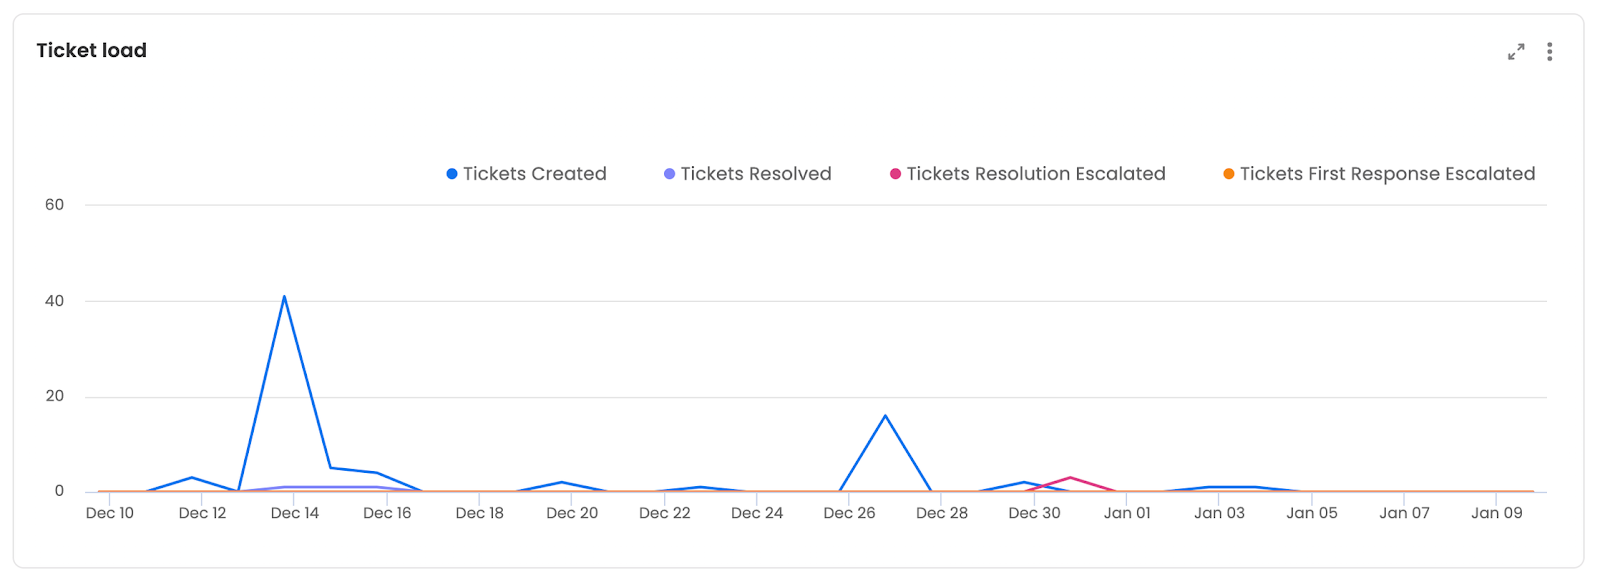
New Ticket Volume Trend
The next panel is a time-series graph showing the count of tickets in the below-mentioned categories-
-
Created - Number of tickets created in successive intervals of time for the selected period
-
Resolved - Number of tickets resolved in successive intervals of time for the selected period
-
Response Escalated - Number of tickets that were response escalated in successive intervals of time for the selected period
-
Resolution Escalated - Number of tickets that were resolution escalated in successive intervals of time for the selected period
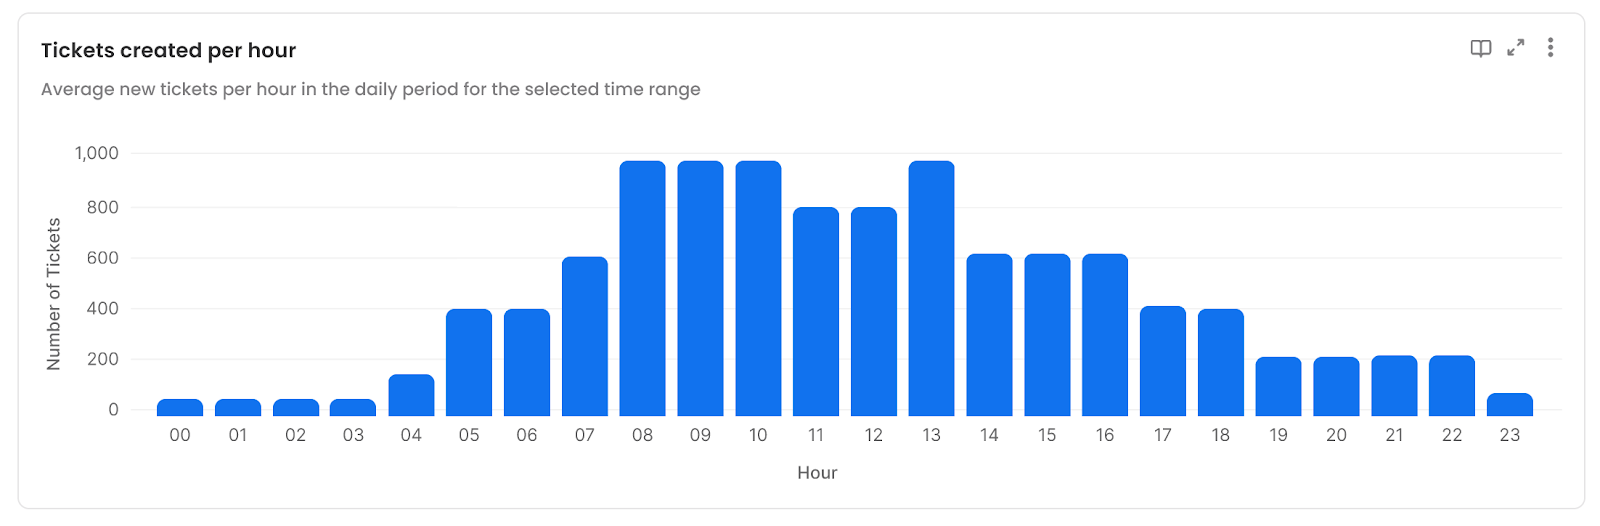
The next panel shows the average hourly distribution of ticket creation during the period. This will include only the new tickets within the active tickets. This will also include deleted tickets.
New Tickets Distribution
Lastly, as part of ticket volume analysis, we also have the ticket distribution based on the following attributes-
- Source of the ticket - Here we are capturing where the ticket was captured from. Leena allows tickets to be created from different sources:
- Created by Employees for themselves
- Created on behalf of an employee by another employee
- Created on behalf of an employee by an agent
- Created by external users (which could include non-users, ex-employees)
- Others (By API, Bulk upload, etc.)
- Medium of the ticket - Here we are capturing the channels from where the tickets were created. For example, it can be Webapp, mobile app, desktop app, Email, MS Teams, Slack, GChat, WhatsApp, API, or Workplace
- Priority - Tickets are prioritized as Urgent, High, Medium, or Low (Please note that in the new CM, we have custom priority values under each priority type)
- Custom Fields - Here, ticket distribution is shown based on any of the extra fields added (of dropdown data type)
Possible validation check: The ticket distribution in all these cases would add up to the total active tickets in the period