
KM Sync Logs
Watch the tutorial
Overview
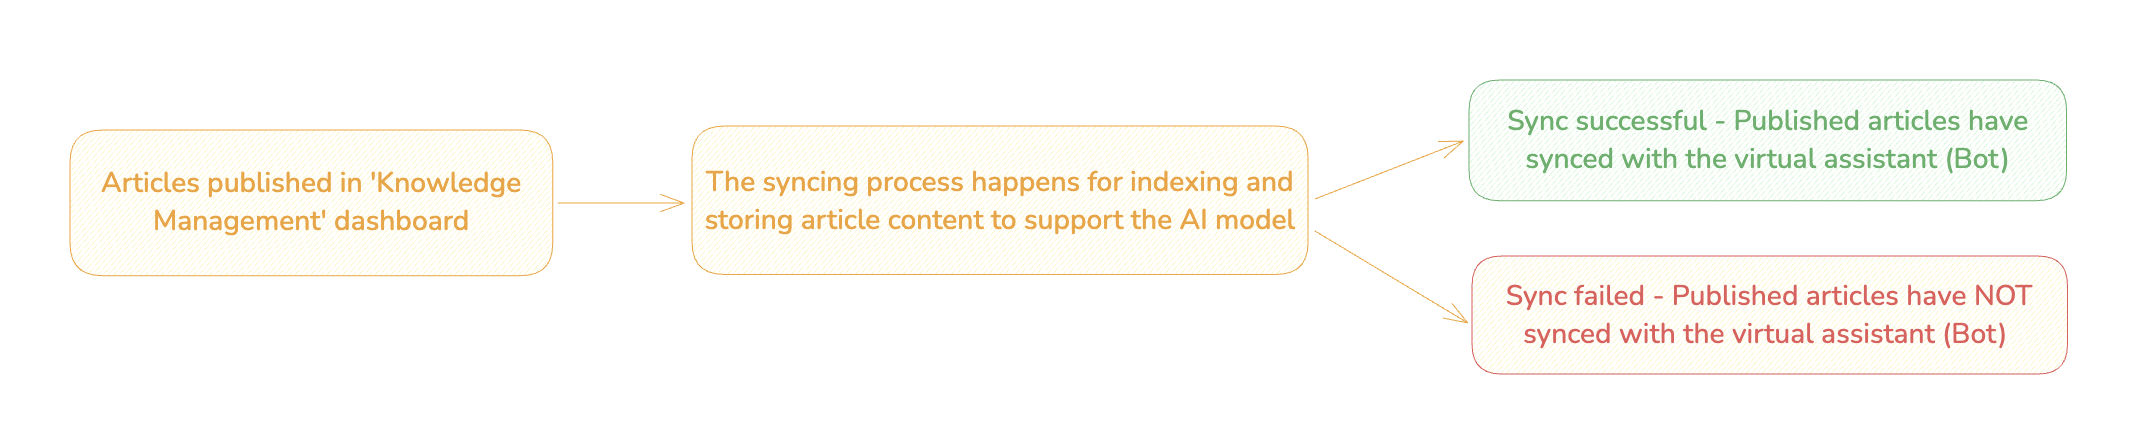
This document outlines the 'Knowledge Management Sync Logs' feature, designed to enhance KM users' visibility into the syncing status of published articles and folders. By providing detailed insights into the sync process between the Knowledge Management dashboard and the virtual assistant, this feature aims to improve transparency and empower users to manage their content efficiently.
Who Can Access "Sync Logs"
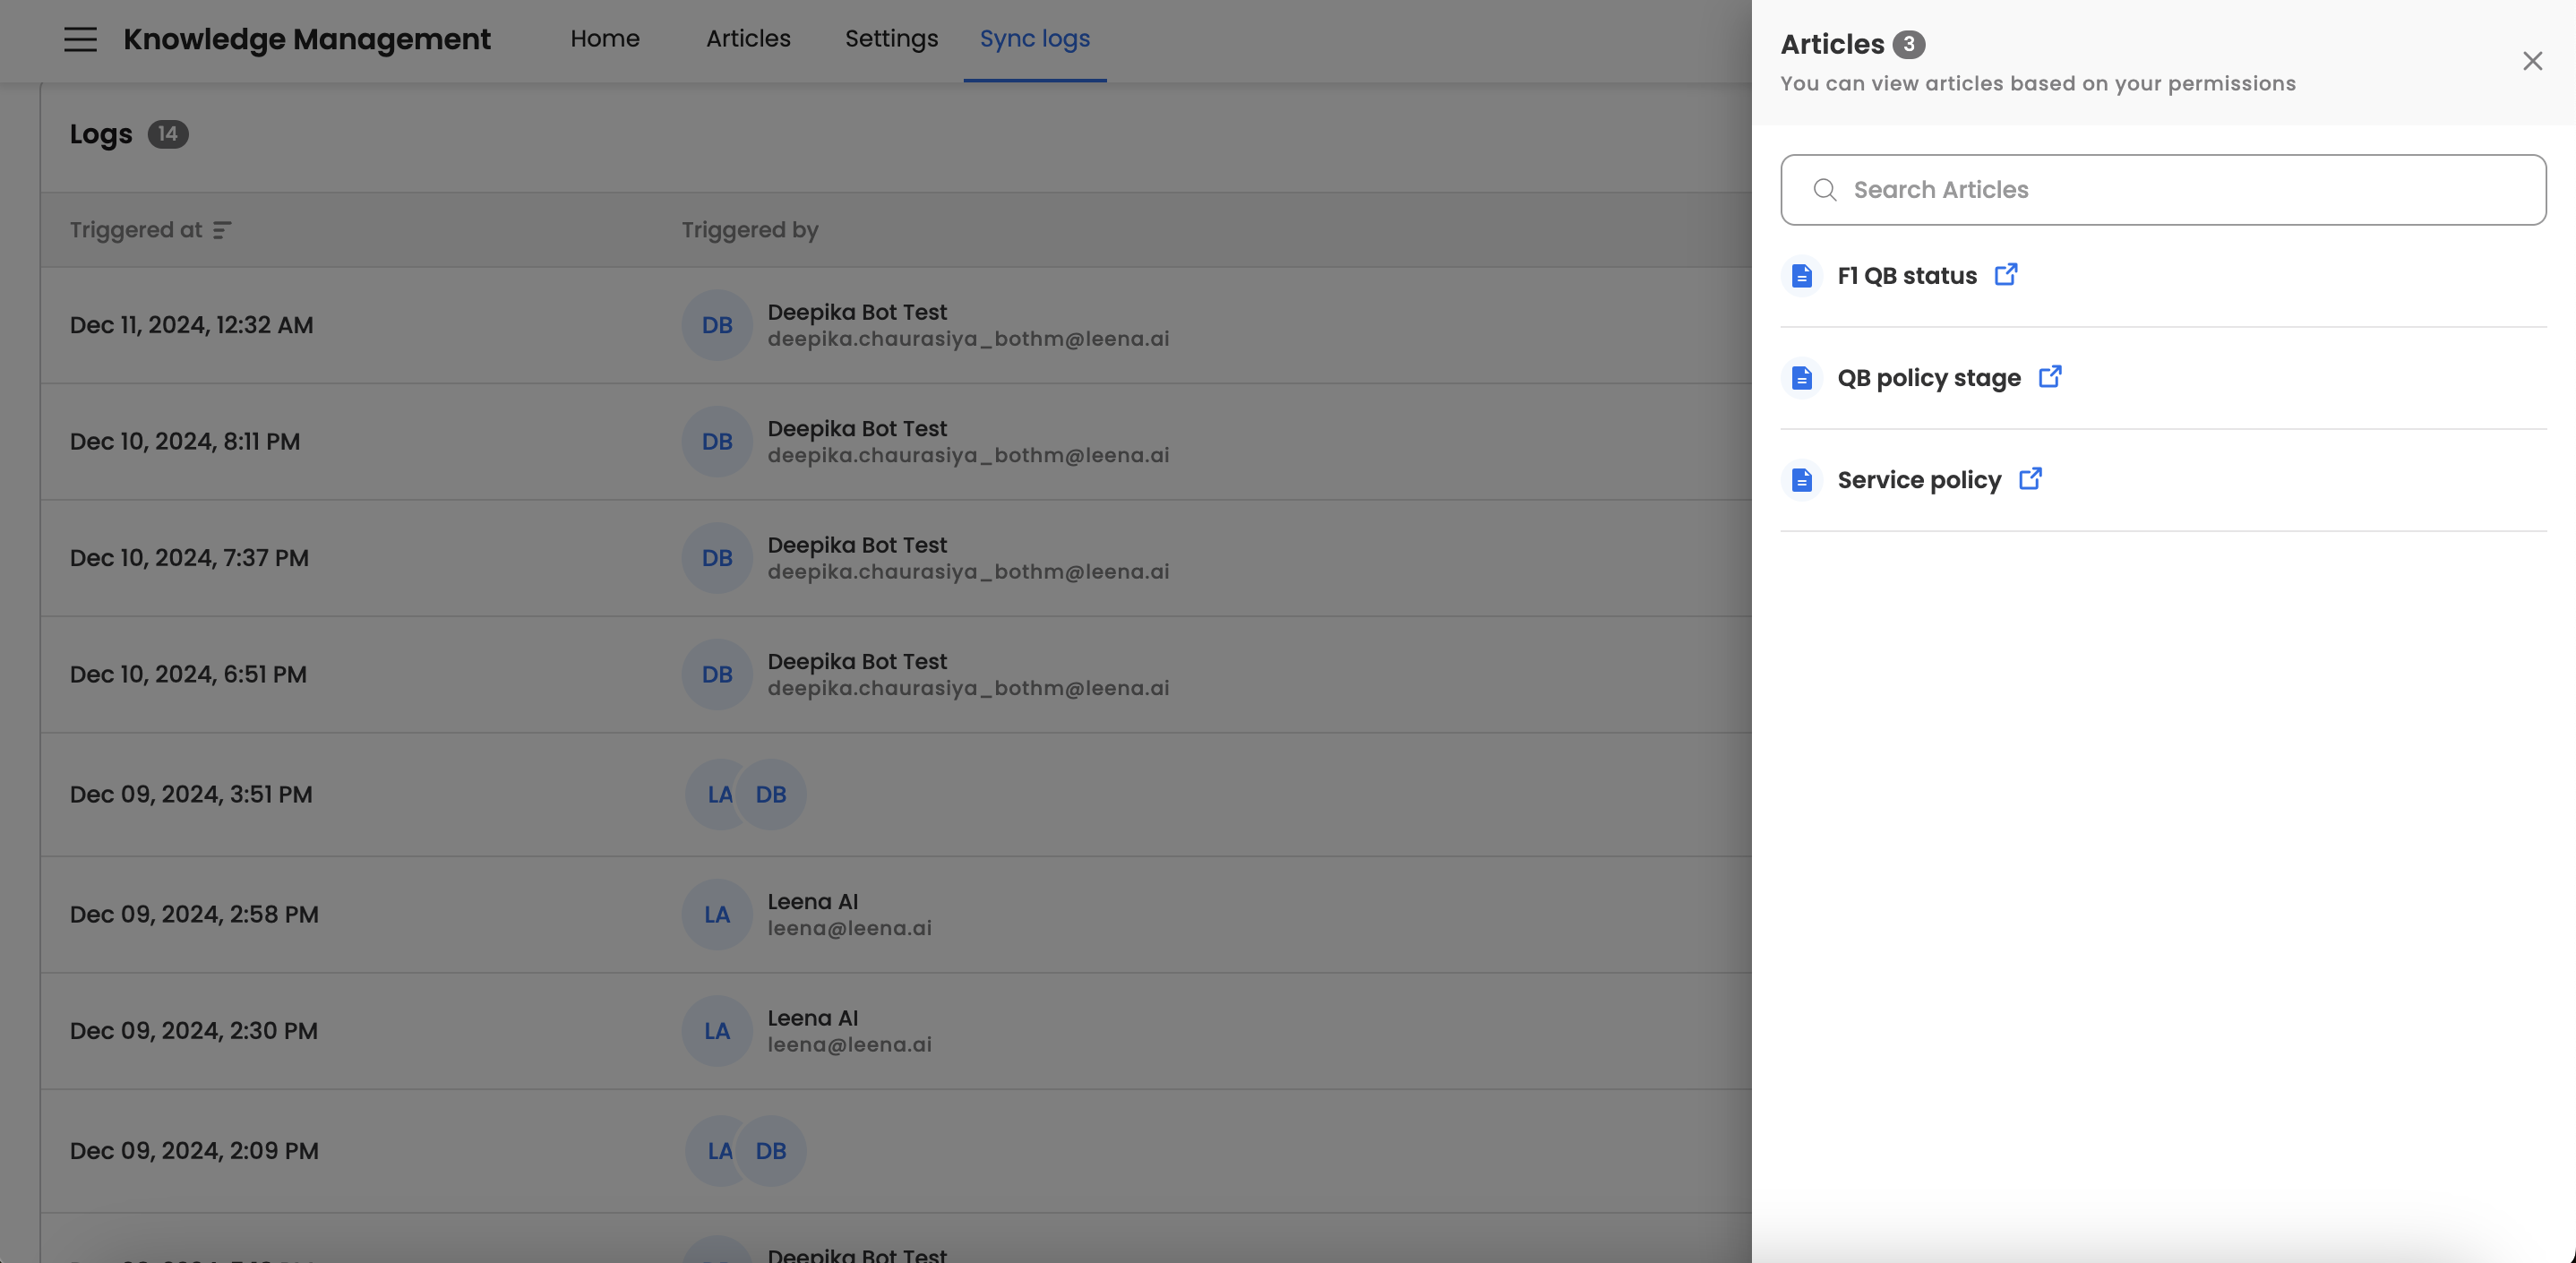
Sync logs will be available to both KM agents and admins.
However, KM agents can view only the articles synced by them.
How to Access "Sync Logs"
Users can either click on the Sync logs from the left menu option.
"Sync Logs": Description
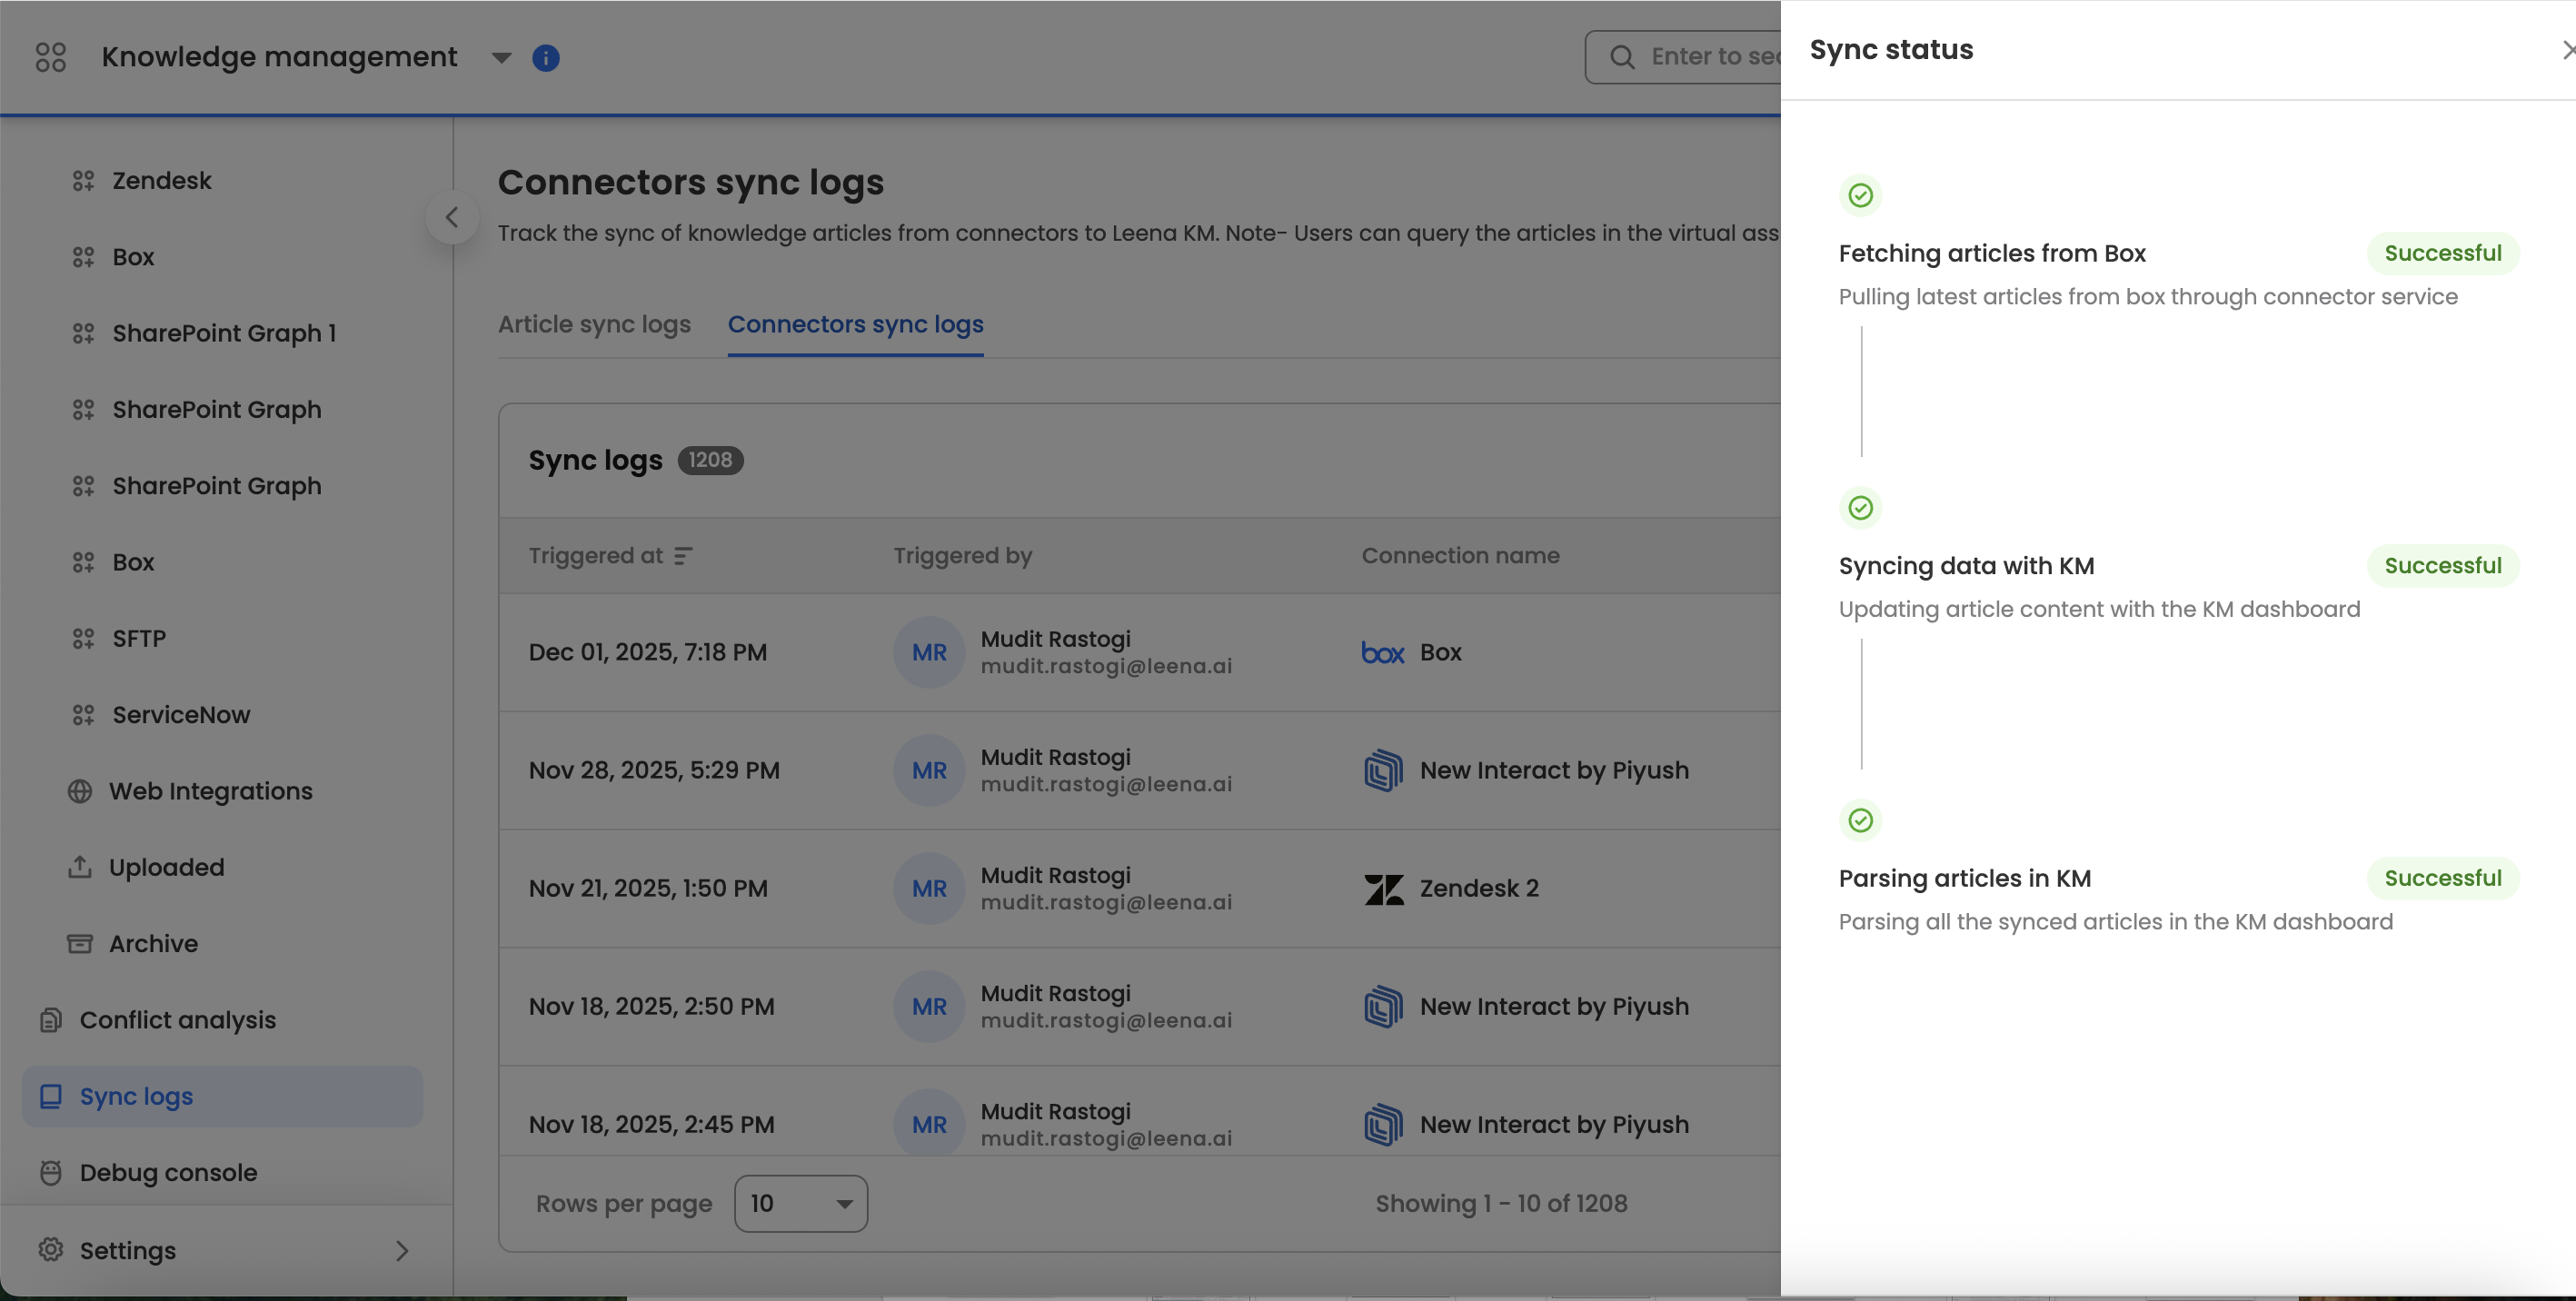
The Knowledge Management (KM) system relies on a two-stage pipeline to ensure your data is available for search. To provide full observability into this process, the system provides two distinct log views:
Connector Sync Logs: Tracks the Ingestion phase (Fetching files from external sources and parsing them).
Article Sync Logs: Tracks the Indexing phase (Processing parsed text and making it searchable).
Understanding the relationship between these two logs is essential for troubleshooting content availability.
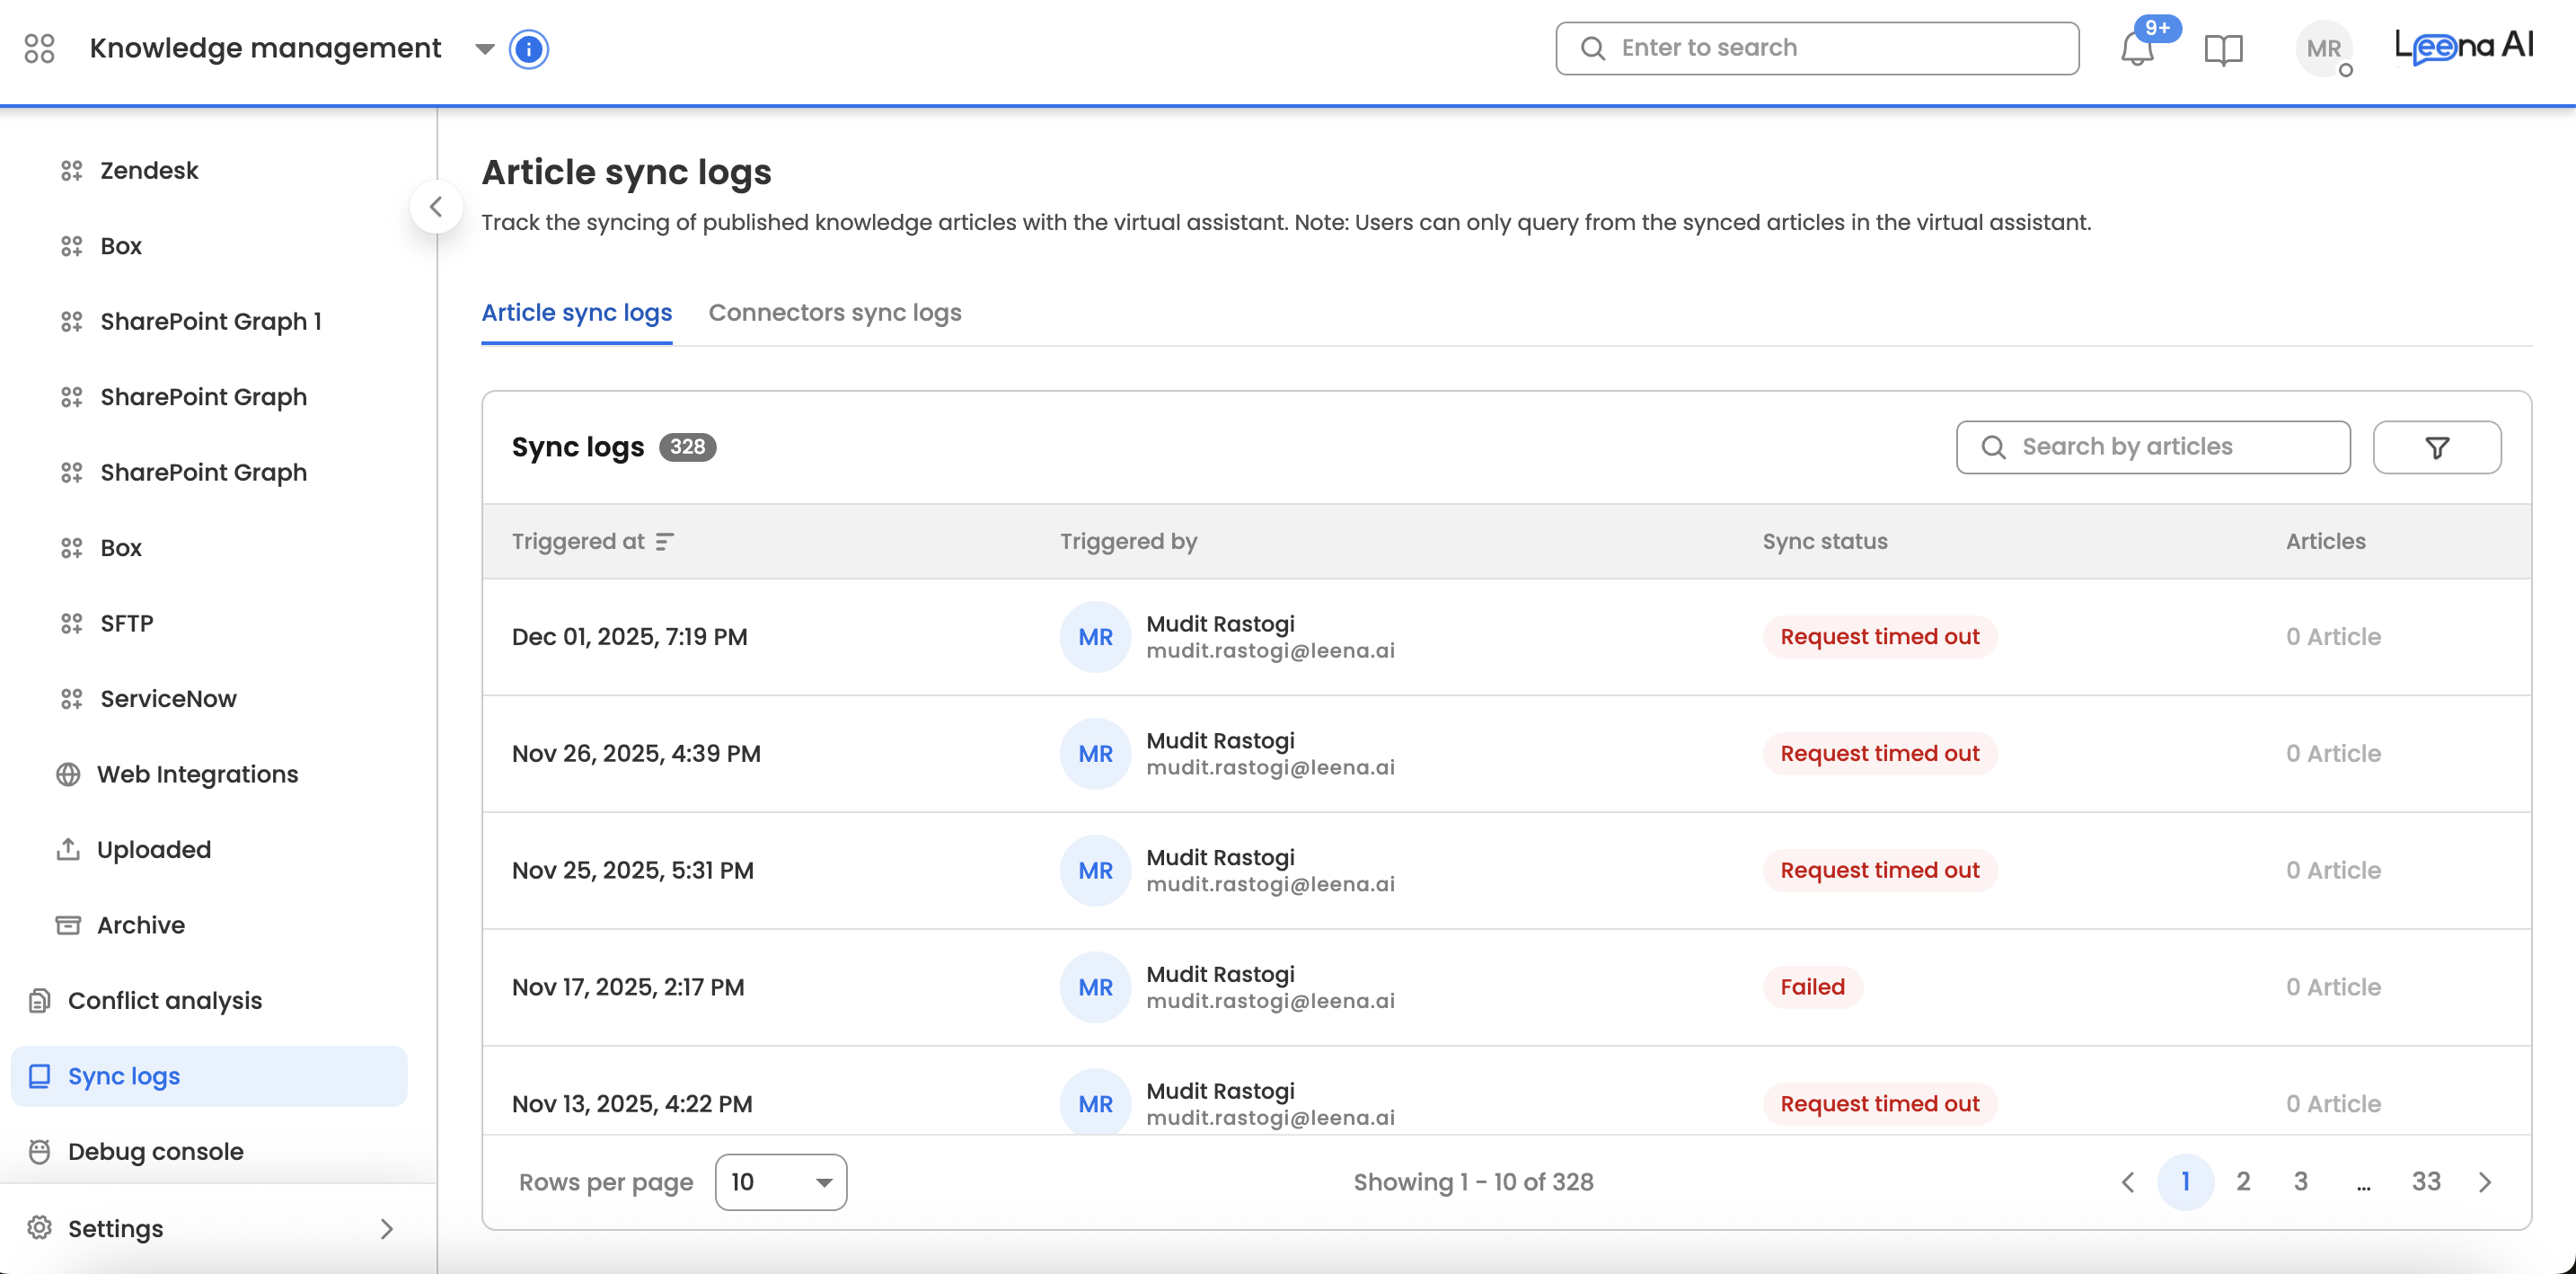
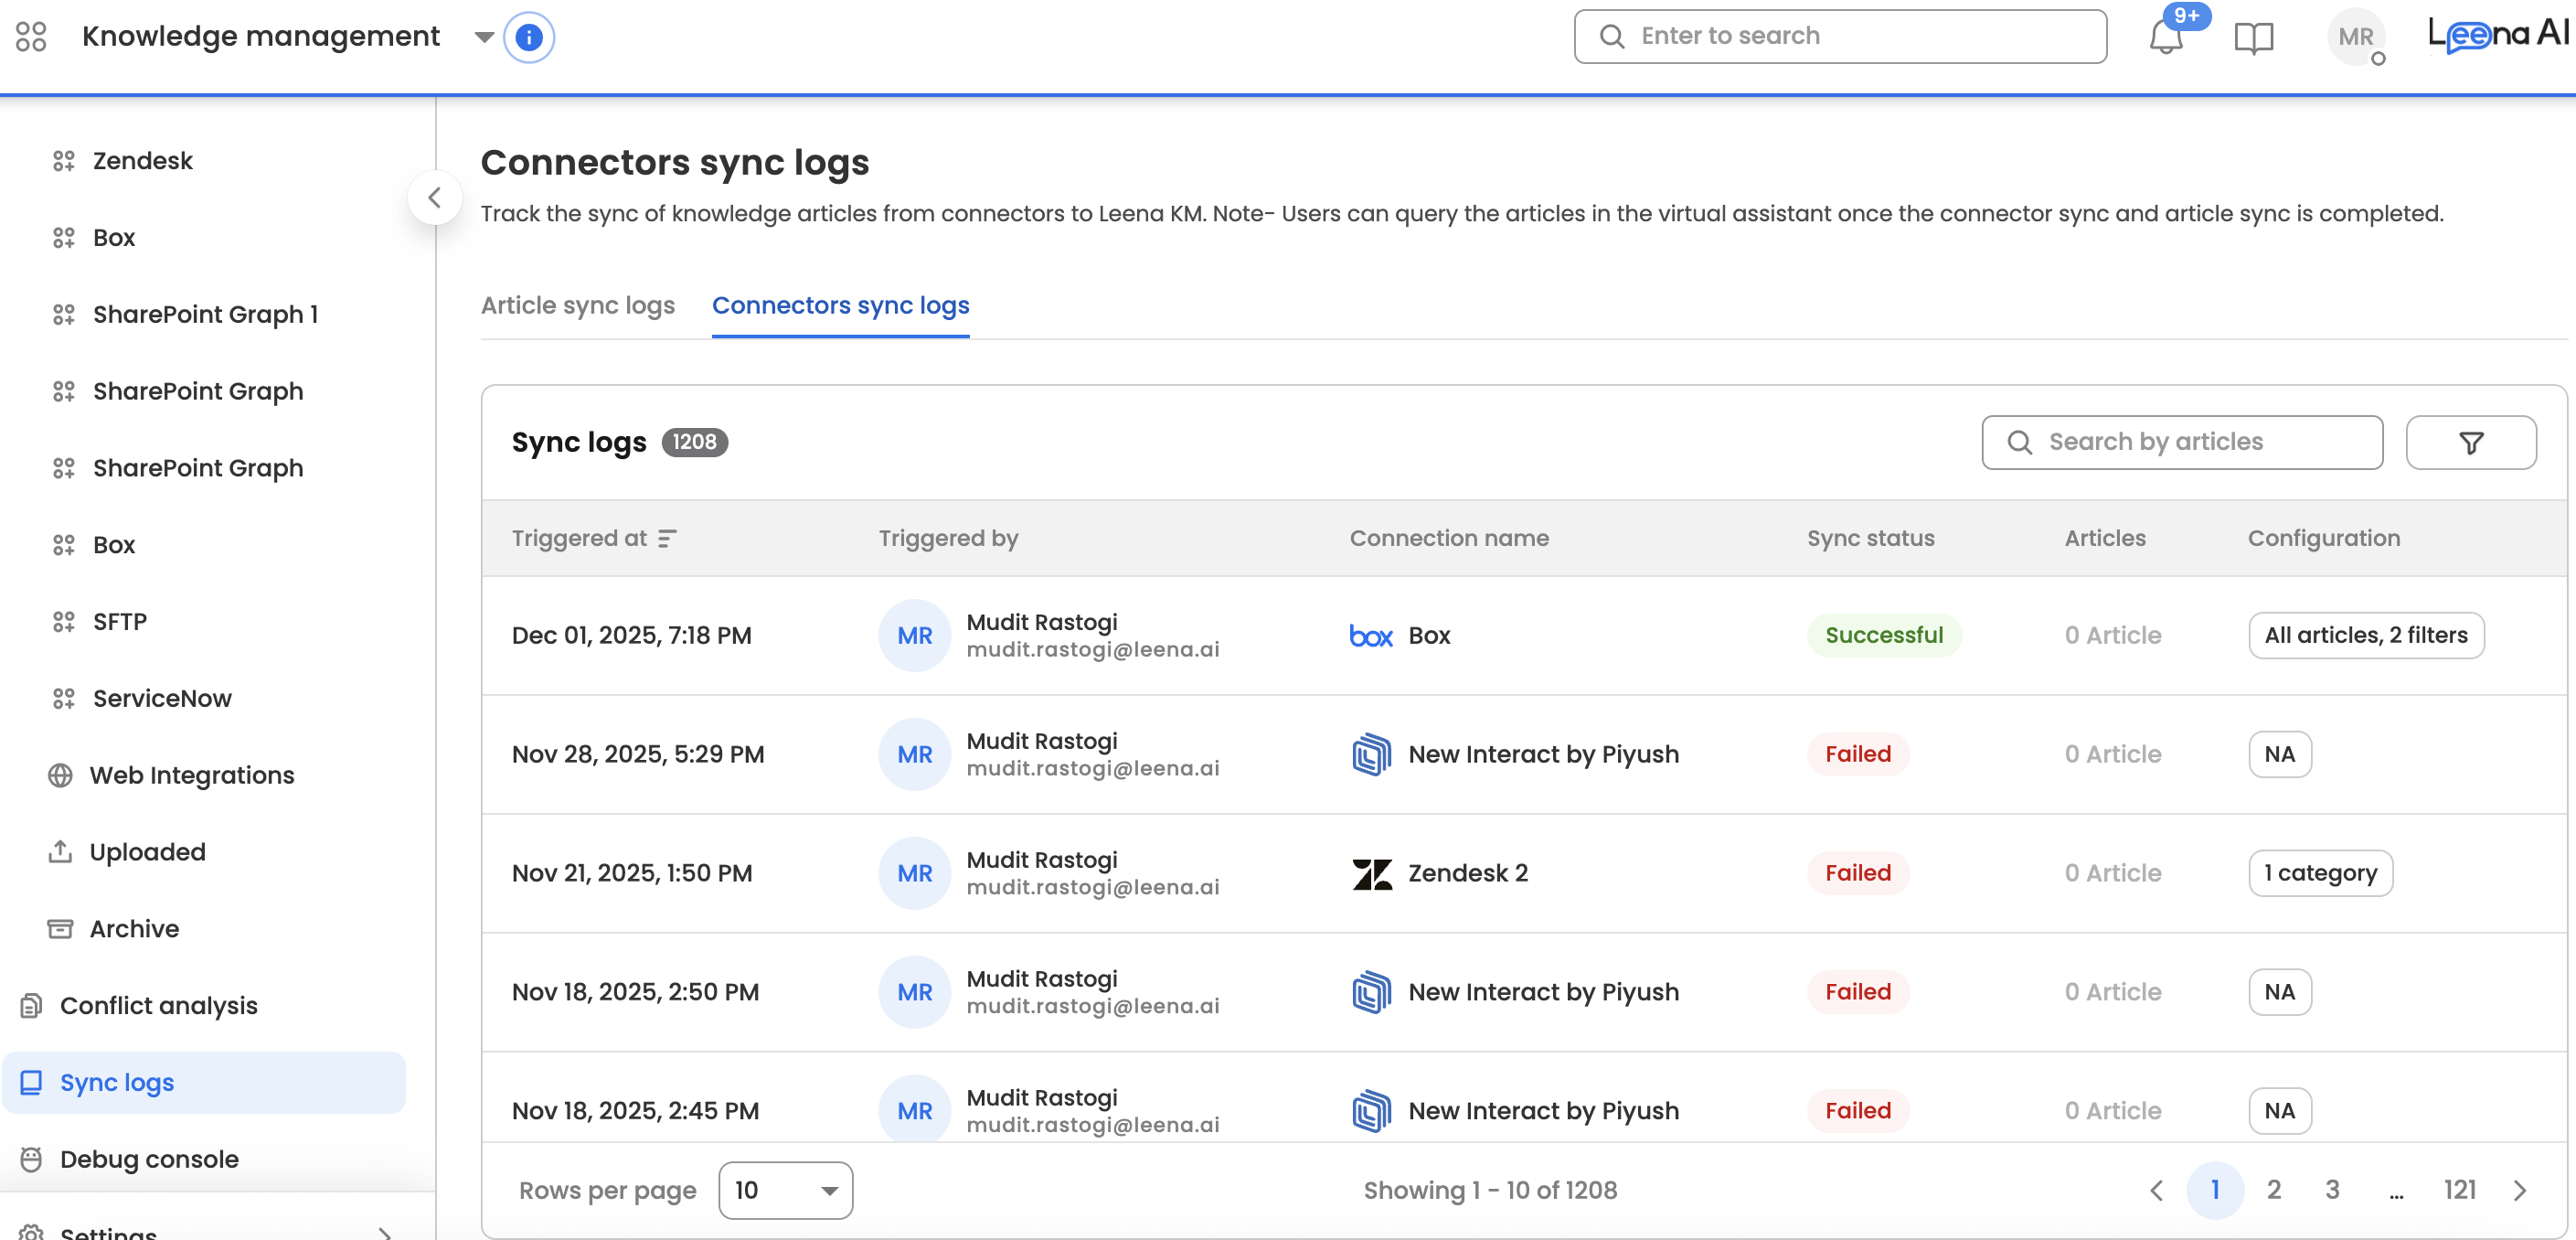
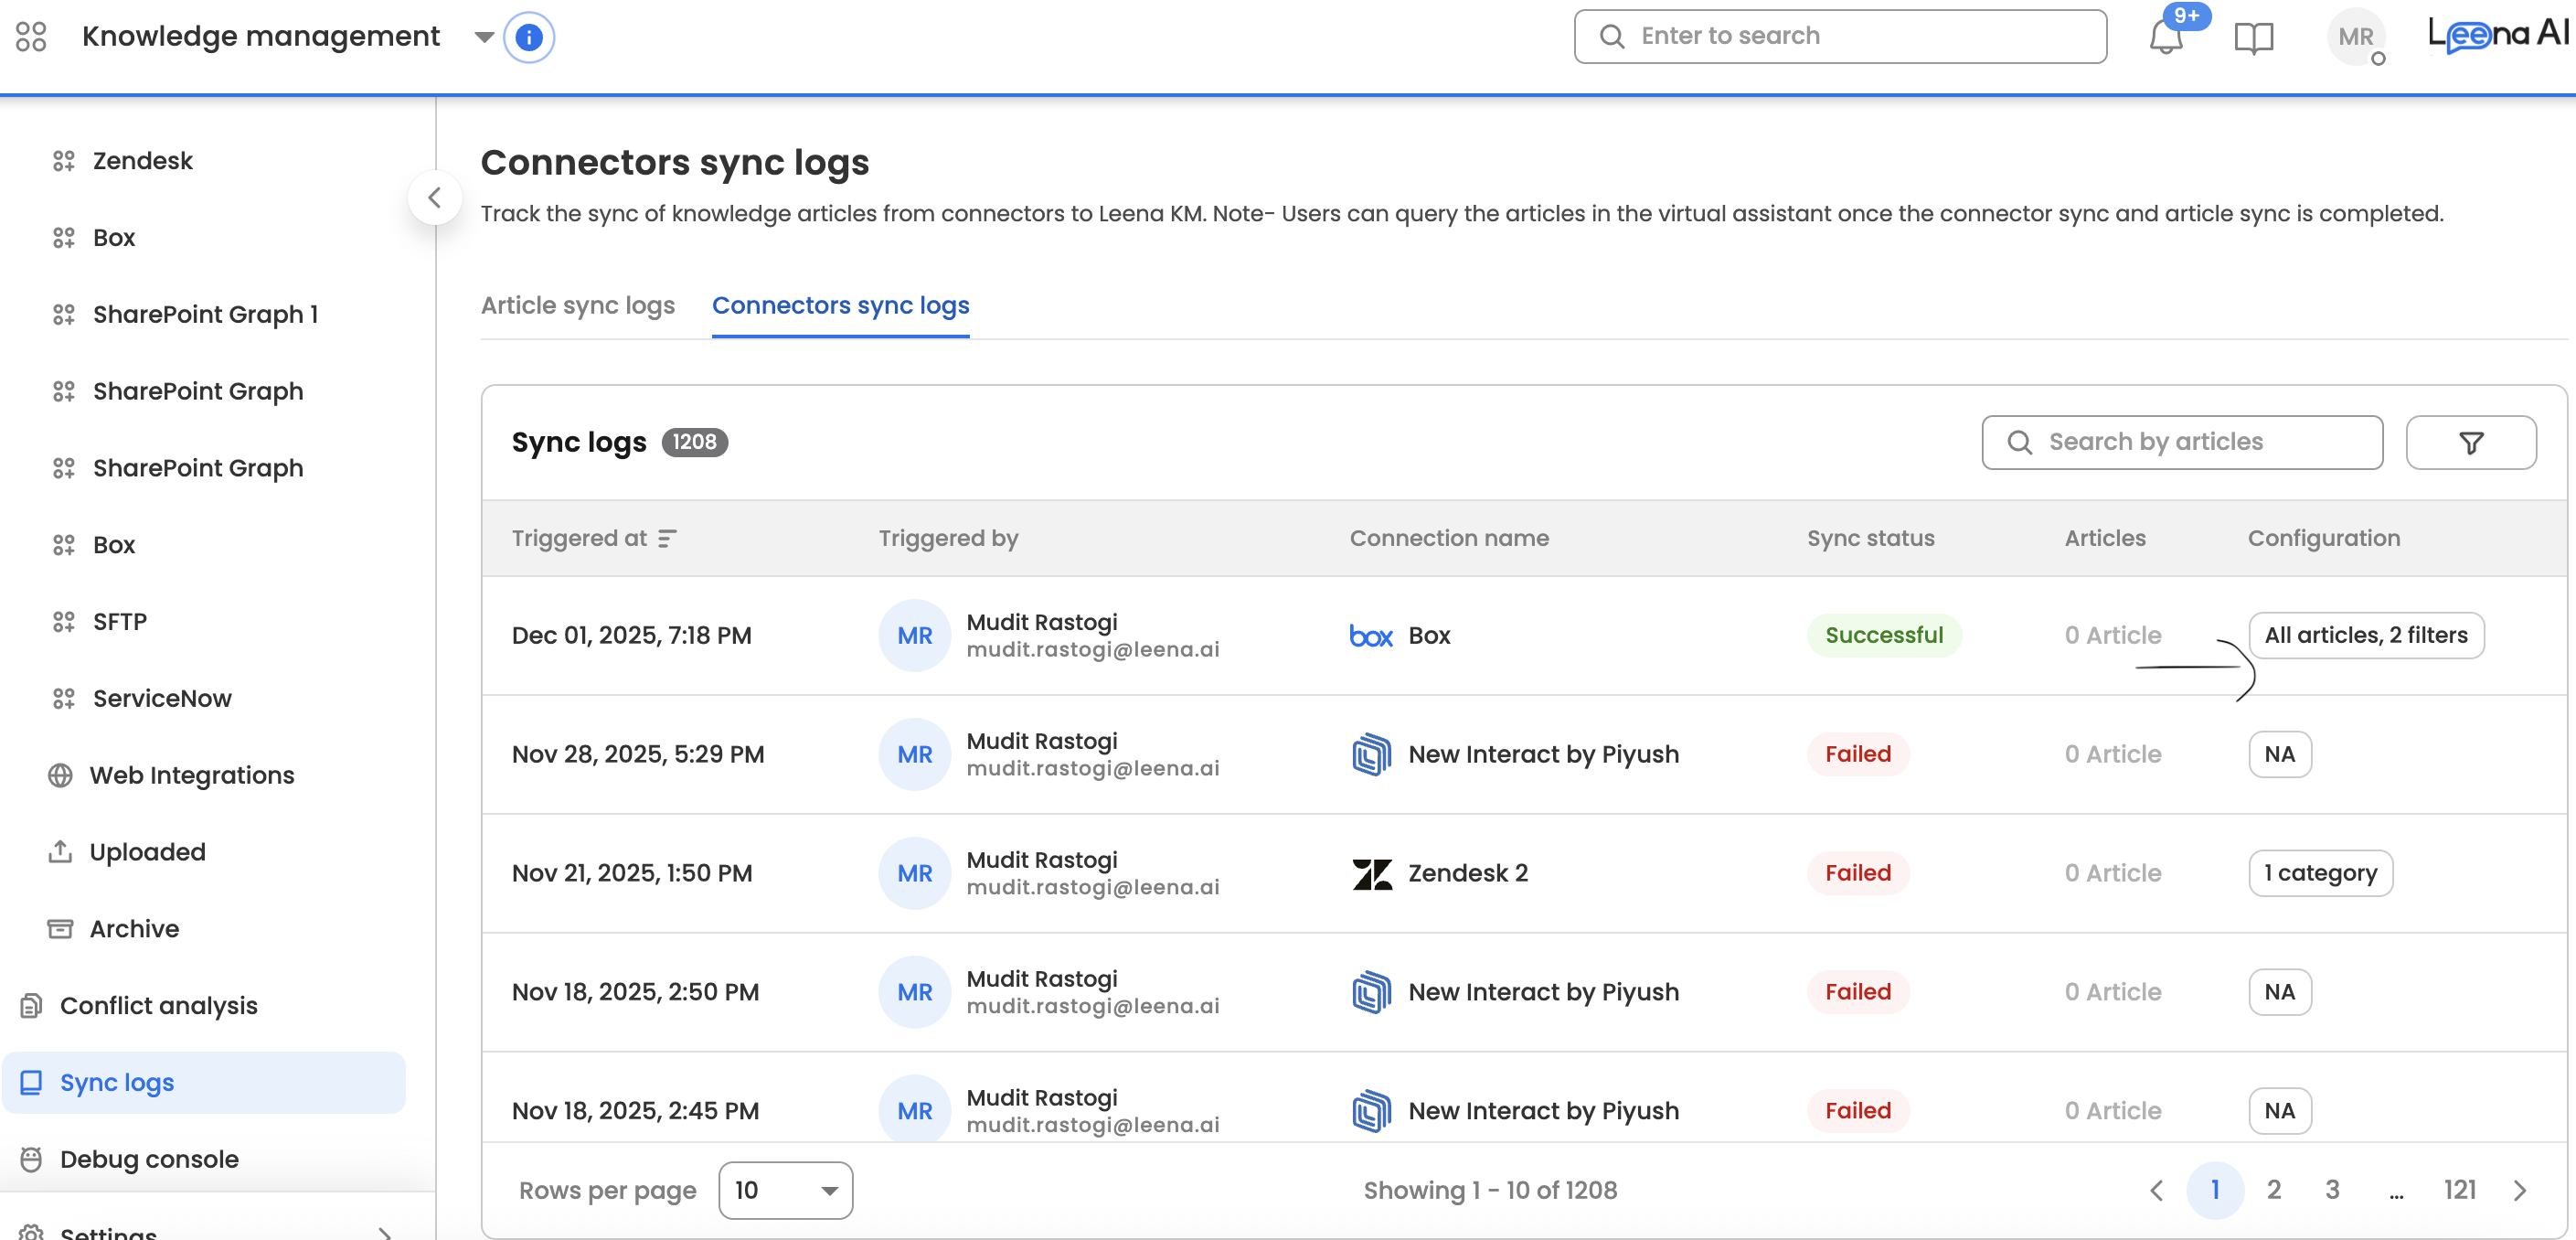
"Sync Logs": Table Values
- Triggered at: The date and time stamp at which the article sync was triggered (i.e., when articles were published in KM).
- Triggered by: The dashboard user(s) who published the article.
- For articles published by Leena backend, the triggered by will be "Leena AI" (no associated email id).
- Sync status: There can be 4 sync statuses - Partially Synced, In-Progress, Successful, and Failed.
- For failed/partially synced cases, click on status to see details/resolution steps.
Note on Failed Syncs: All articles whose sync "failed" will be automatically included for syncing in the next sync triggered. Users do not need to re-publish them.
-
Articles: The articles which got synced. Users can also check the article details by clicking on the article number.
- Configurations: These are only visible for connector sync logs, details are included below.
Viewing Configuration Details
In addition to monitoring success rates and item counts, the Sync Logs table allows you to inspect the specific configuration settings associated with each sync entry. This is essential for verifying that a sync targeted the correct content or for debugging authentication failures without navigating to the main settings page.
The Configuration Column
The Configuration column provides a high-level summary of the sync scope. Clicking the summary text in any row opens the detailed configuration view.
The summary format adapts based on the connector type:
| Connector Type | Summary Format | Examples |
|---|---|---|
| Hierarchical(e.g., SharePoint, Confluence) | [N] [Spaces/Sites], [M] Filters | 3 Spaces, 2 Filters``1 Site (No Filters) |
| Generic(Non-Hierarchical) | All Content ([M] Filters) | All Content (1 Filter)``All Content (No Filters) |
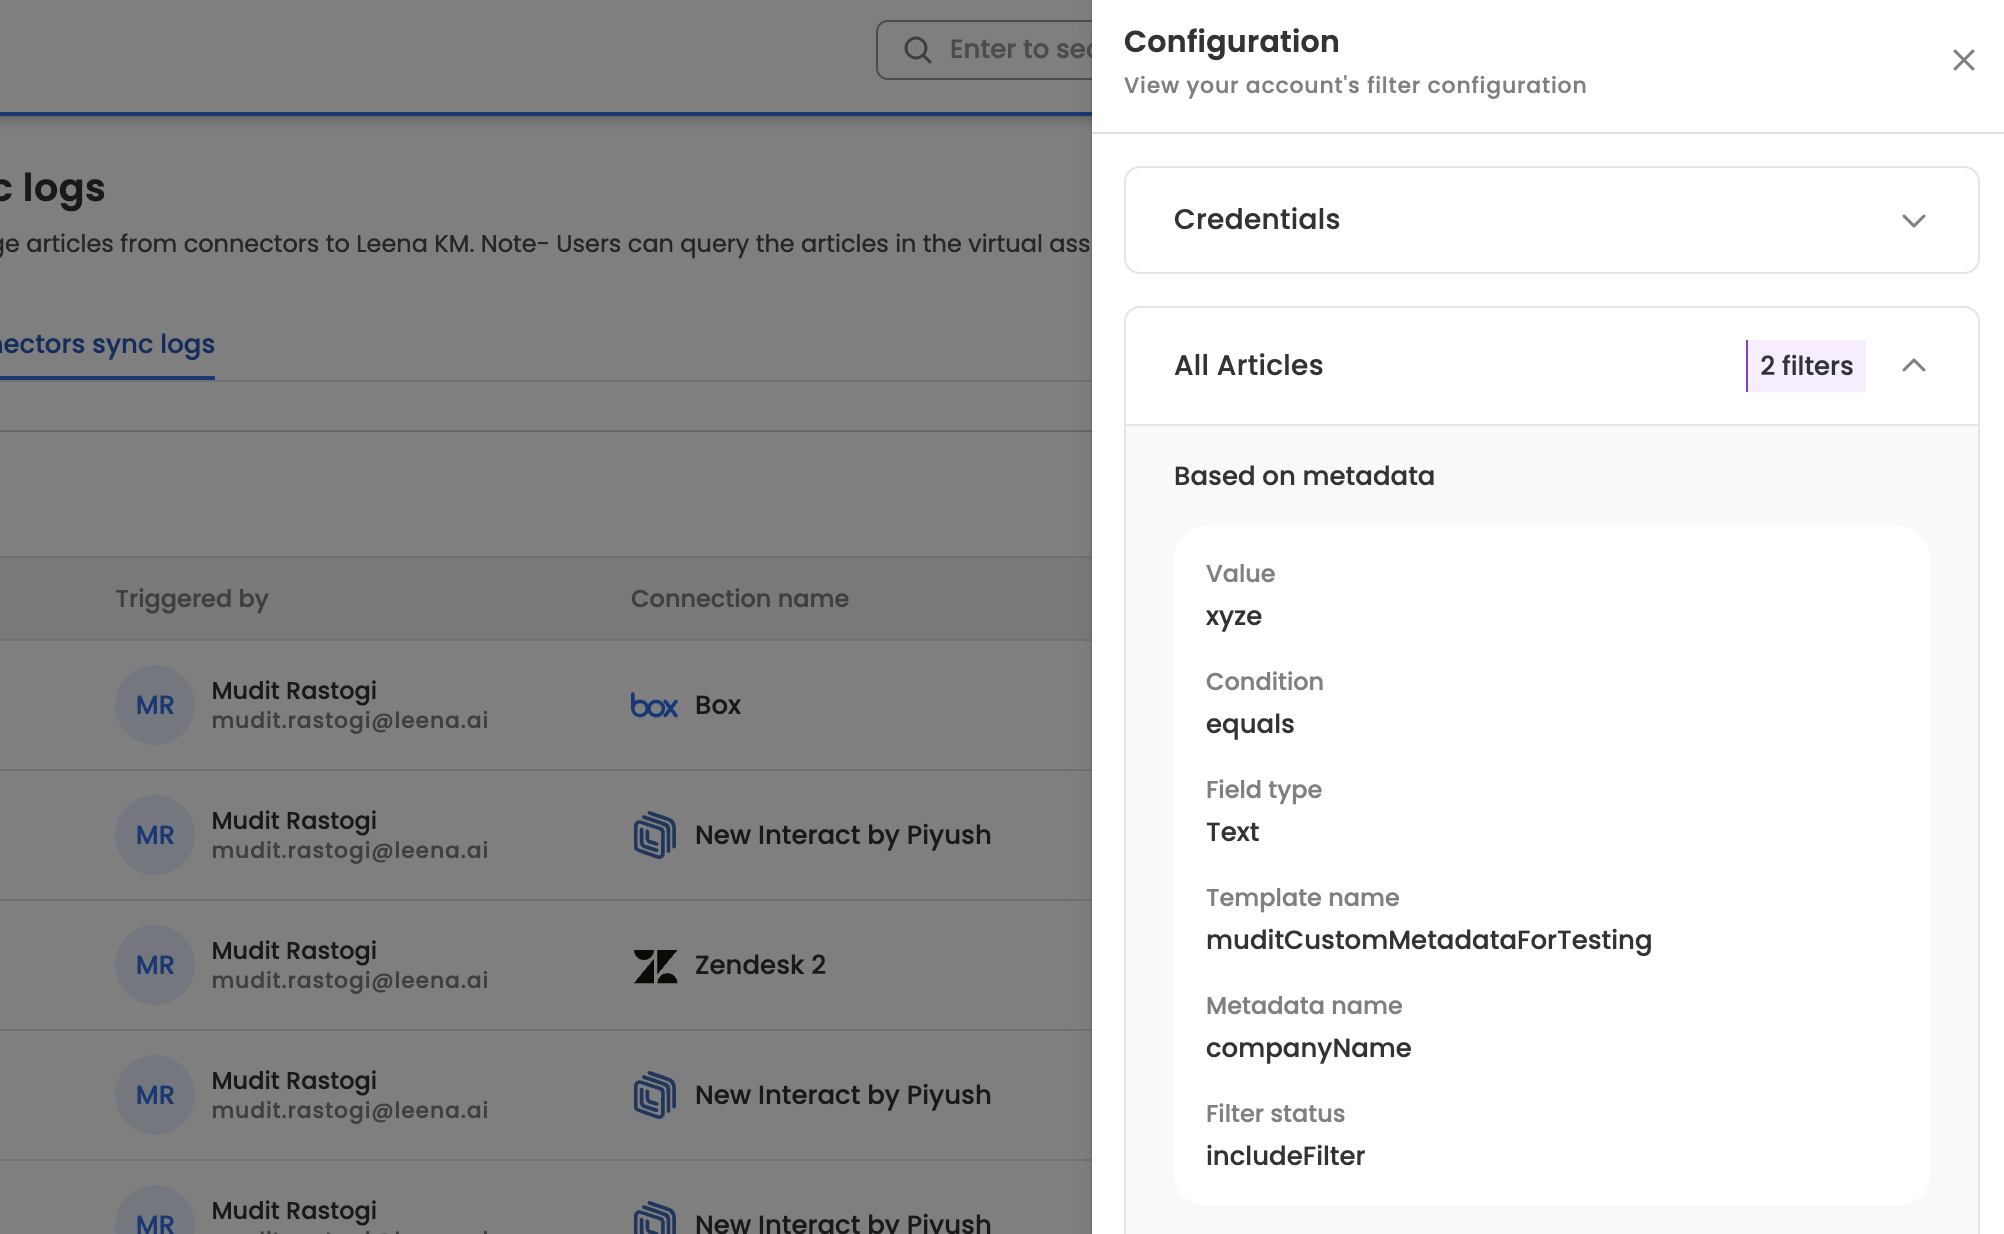
Configuration Details Sidesheet
Clicking the configuration summary opens a read-only sidesheet containing three diagnostic sections:
1. Credentials & Connection Details
Located at the top of the sidesheet, this panel displays the operational parameters used for the connection.
- Usage: Use this to verify authentication settings (e.g., checking if an API token has expired) or to confirm that the target URL/Environment is correct.
- Includes: Connection identifiers, authentication types, file inclusion rules, and target environment details.
2. Sync Scope
This section lists the specific content sources targeted by the sync.
- Hierarchical Connectors: specific Spaces, Sites, or Knowledge Bases are listed here.
- Generic Connectors: Indicates "Full Knowledge Base".
3. Metadata Filters
Lists any inclusion or exclusion filters that were applied to the sync logic (e.g., specific tags or categories).
Limitations
- Read-Only: To modify credentials, scopes, or filters, you must navigate to the main Connector Settings page.