
Run history
Watch the tutorial
Run History provides comprehensive visibility into all AI Colleague executions across your organisation. It enables administrators, managers, and implementation teams to monitor performance, troubleshoot issues, and analyse business outcomes through a centralised dashboard.
Key Components:
- Executions Table: View and manage all AI Colleague runs in a sortable, filterable table
- Global Filters: Filter executions by time range, AI Colleague, AOP, status, and more
- Run Details: Drill down into individual executions for step-by-step analysis
- Run Cancellation: Cancel in-progress runs, individually or in bulk
- Export Capabilities: Export execution data for external analysis and compliance
Accessing Run History
-
Navigate to AI Colleagues from the main navigation
-
In the left sidebar, expand Insights
-
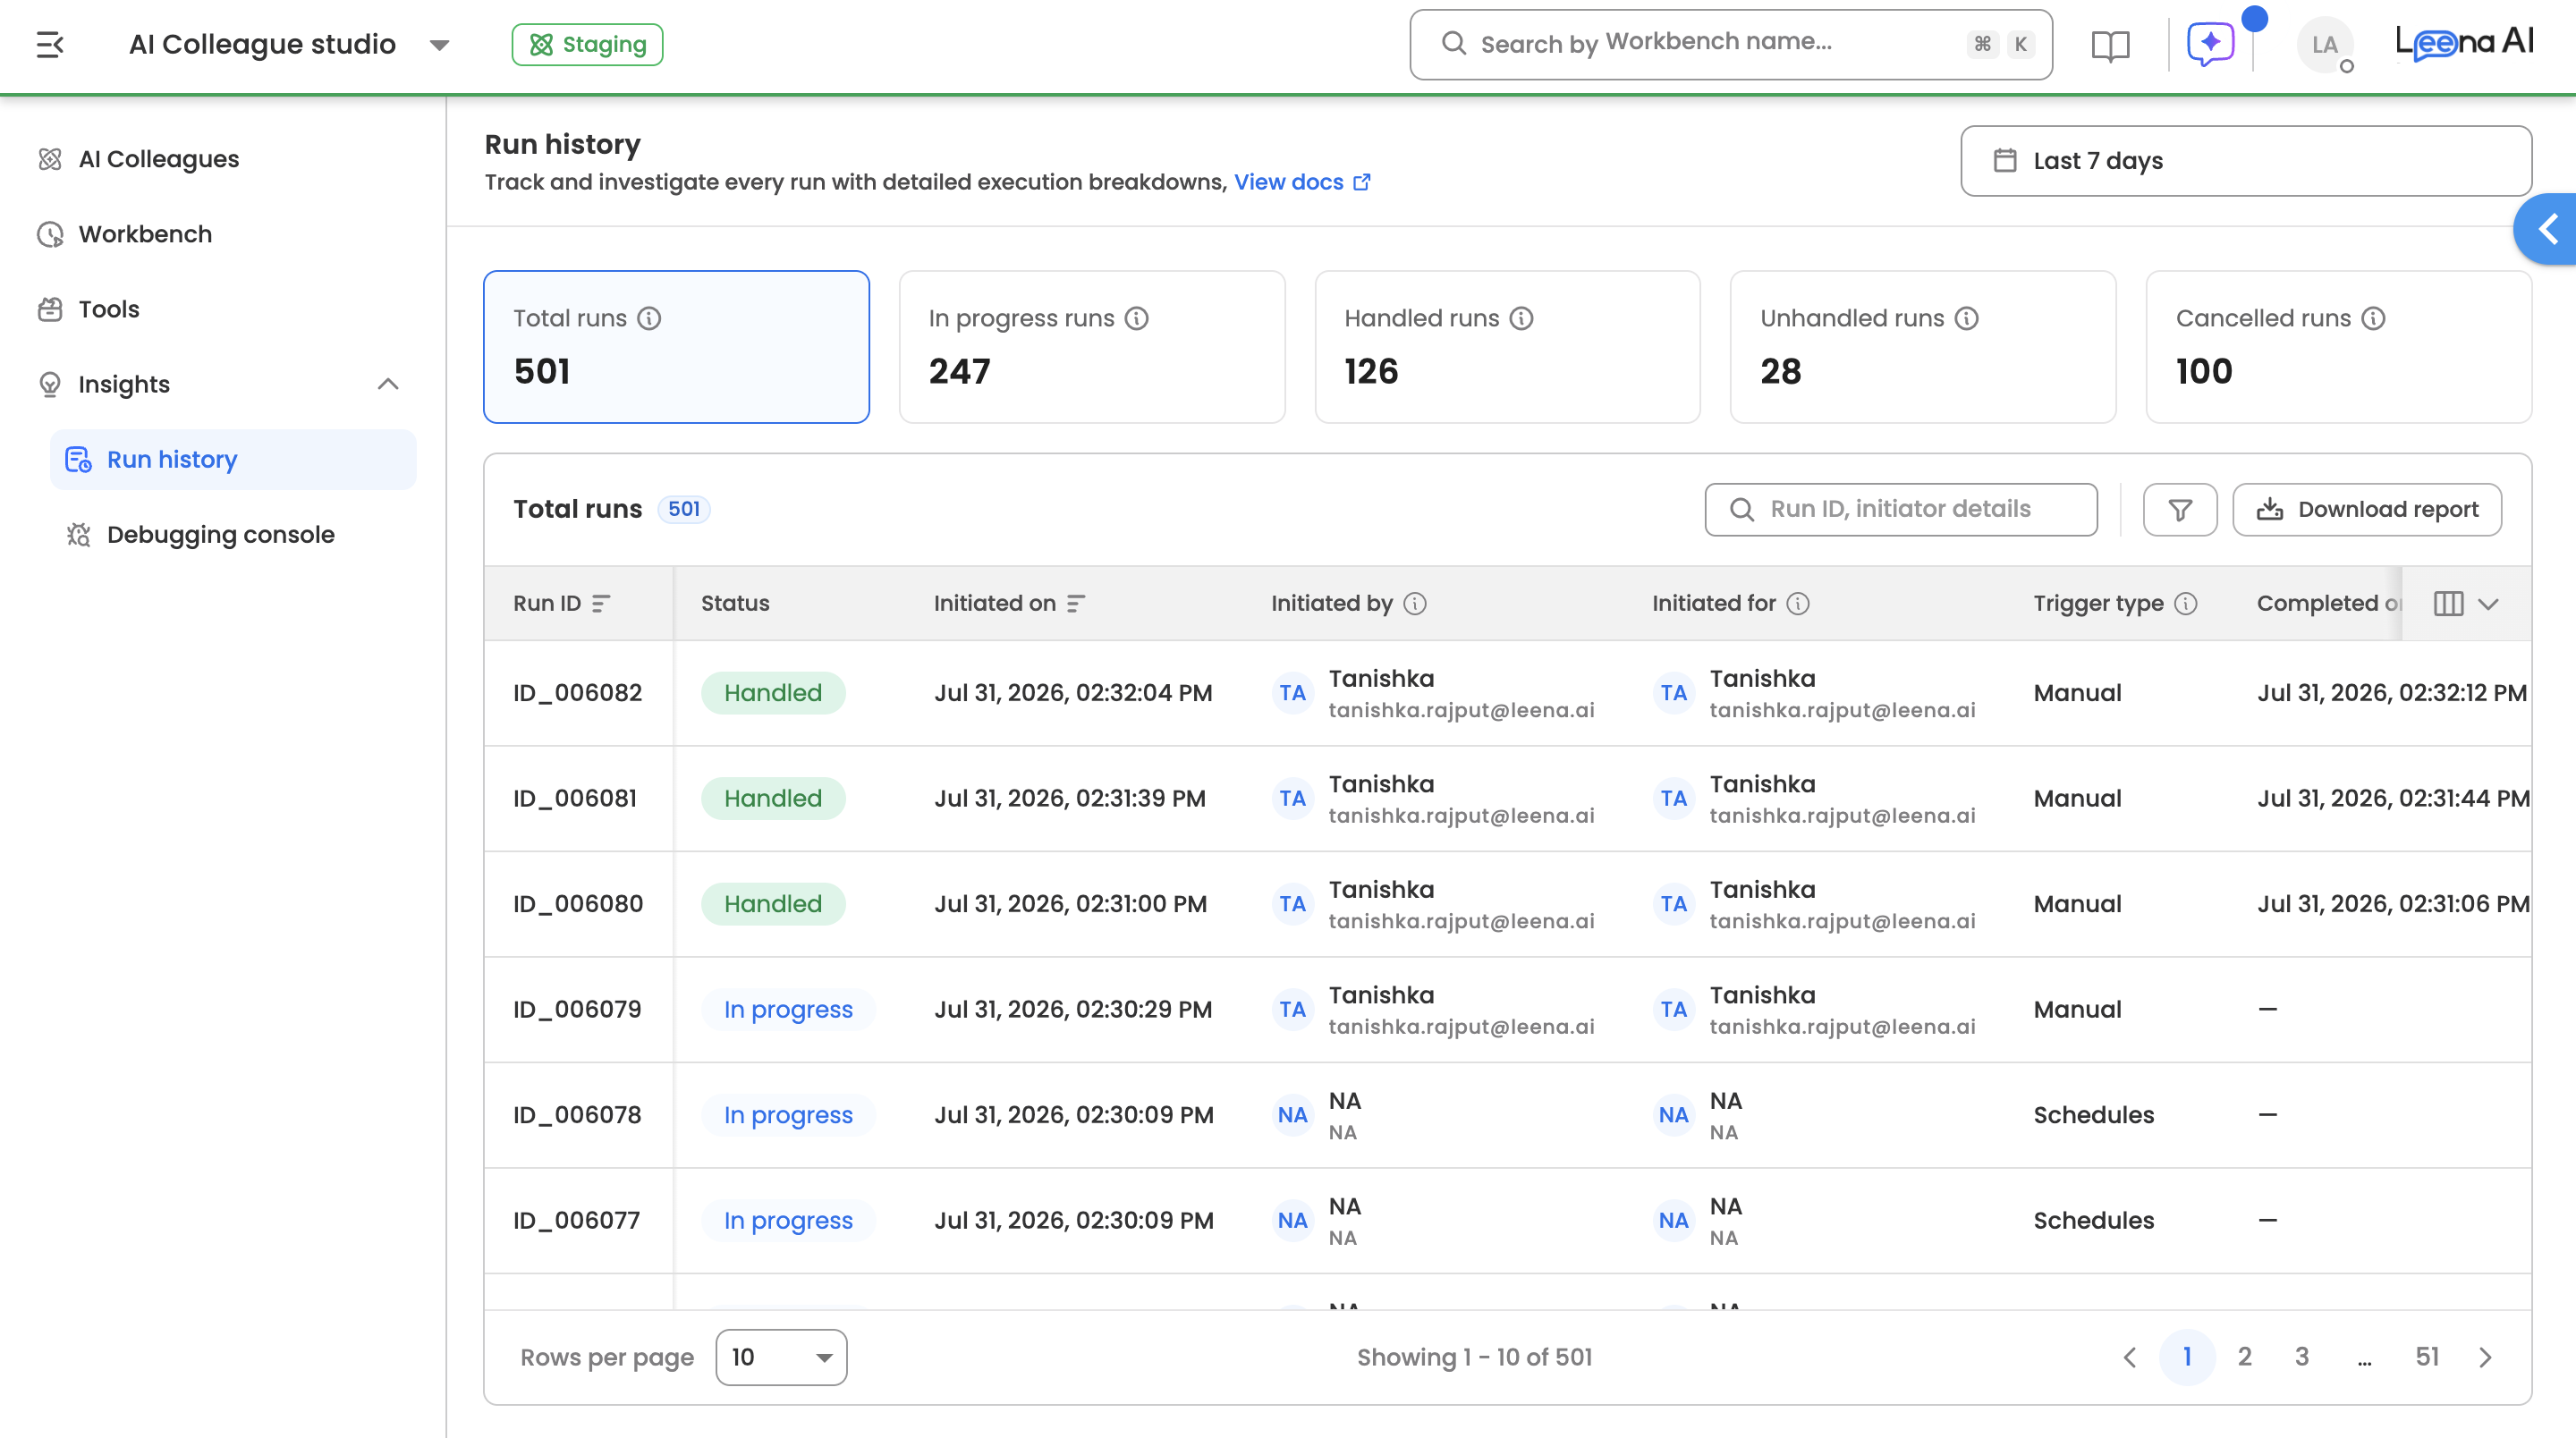
Click Run history: The default landing view displays the Executions Table with the most recent runs.
User Personas:
Role Access Level System Admins Full access to all AI Colleague executions and configurations
Executions Table
The Executions Table displays all AI Colleague runs in a comprehensive, sortable format. Each row represents a single execution with key metadata for quick assessment.
Default Table Columns
| Column | Description |
|---|---|
| Run ID | Unique identifier for the execution. Clickable to open drill-down view. |
| Handled by | AI Colleague(s) that handled the request/run. |
| Trigger Type | How the execution was initiated: Manual, System/Workbench, or API |
| Status | Current execution state with colour coding (see Status Definitions below) |
| Initiated By | User who triggered the execution (Manual), or "N/A" for Workbench/API triggers |
| Initiated For | User for whom the request was raised, or "N/A" |
| Initiated On | Timestamp when the request was initiated (sortable) |
| Completed On | Timestamp when finished, or "N/A" for in-progress executions |
| Total Time Taken | Duration in format: X Year(s) X Month(s) X Day(s) X Hour(s) |
| Input Tokens | Total input tokens consumed across all LLM calls in the run |
| Output Tokens | Total output tokens consumed across all LLM calls in the run |
Status Definitions
| Status | Description |
|---|---|
| Handled | Request completed successfully |
| Unhandled | Request failed during execution |
| In Progress | Execution currently running (includes waiting for user input) |
| Cancelled | Request cancelled — by the user, by the system, or by an admin from Run History (see Cancelling In-Progress Runs) |
Additional Available Columns
The following columns can be enabled via the Edit Columns option:
| Column | Description |
|---|---|
| Escalation | True/False - whether escalation to Escalation Manager occurred |
| Channel | Communication channel: Voice, Slack, Web, etc. |
| Associated AOPs | List of AOPs executed during the run |
| Associated Tools | List of Tools executed during the run |
| Schedule Name | Name of the schedule (for System/Workbench triggers) |
| Participation Coverage | Participants involved (clickable to view list) |
| Unhandled Due To | Category of failure (see Failure Categories) |
| Unhandled Reason | Detailed LLM-generated failure explanation |
| Cancelled By | Admin who cancelled the run. Empty for user- or system-generated cancellations |
| Cancellation Reason | The note entered when the run was cancelled |
Filtering & Search
Global Filters
Filters persist across your session and can be combined to narrow down results.
Time Range Filter
| Option | Description |
|---|---|
| Last 7 days | Executions from the past week |
| Last 30 days | Executions from the past month (default) |
| Last 90 days | Executions from the past quarter |
| Till Now | All executions since deployment |
| Custom | Specify custom start and end dates |
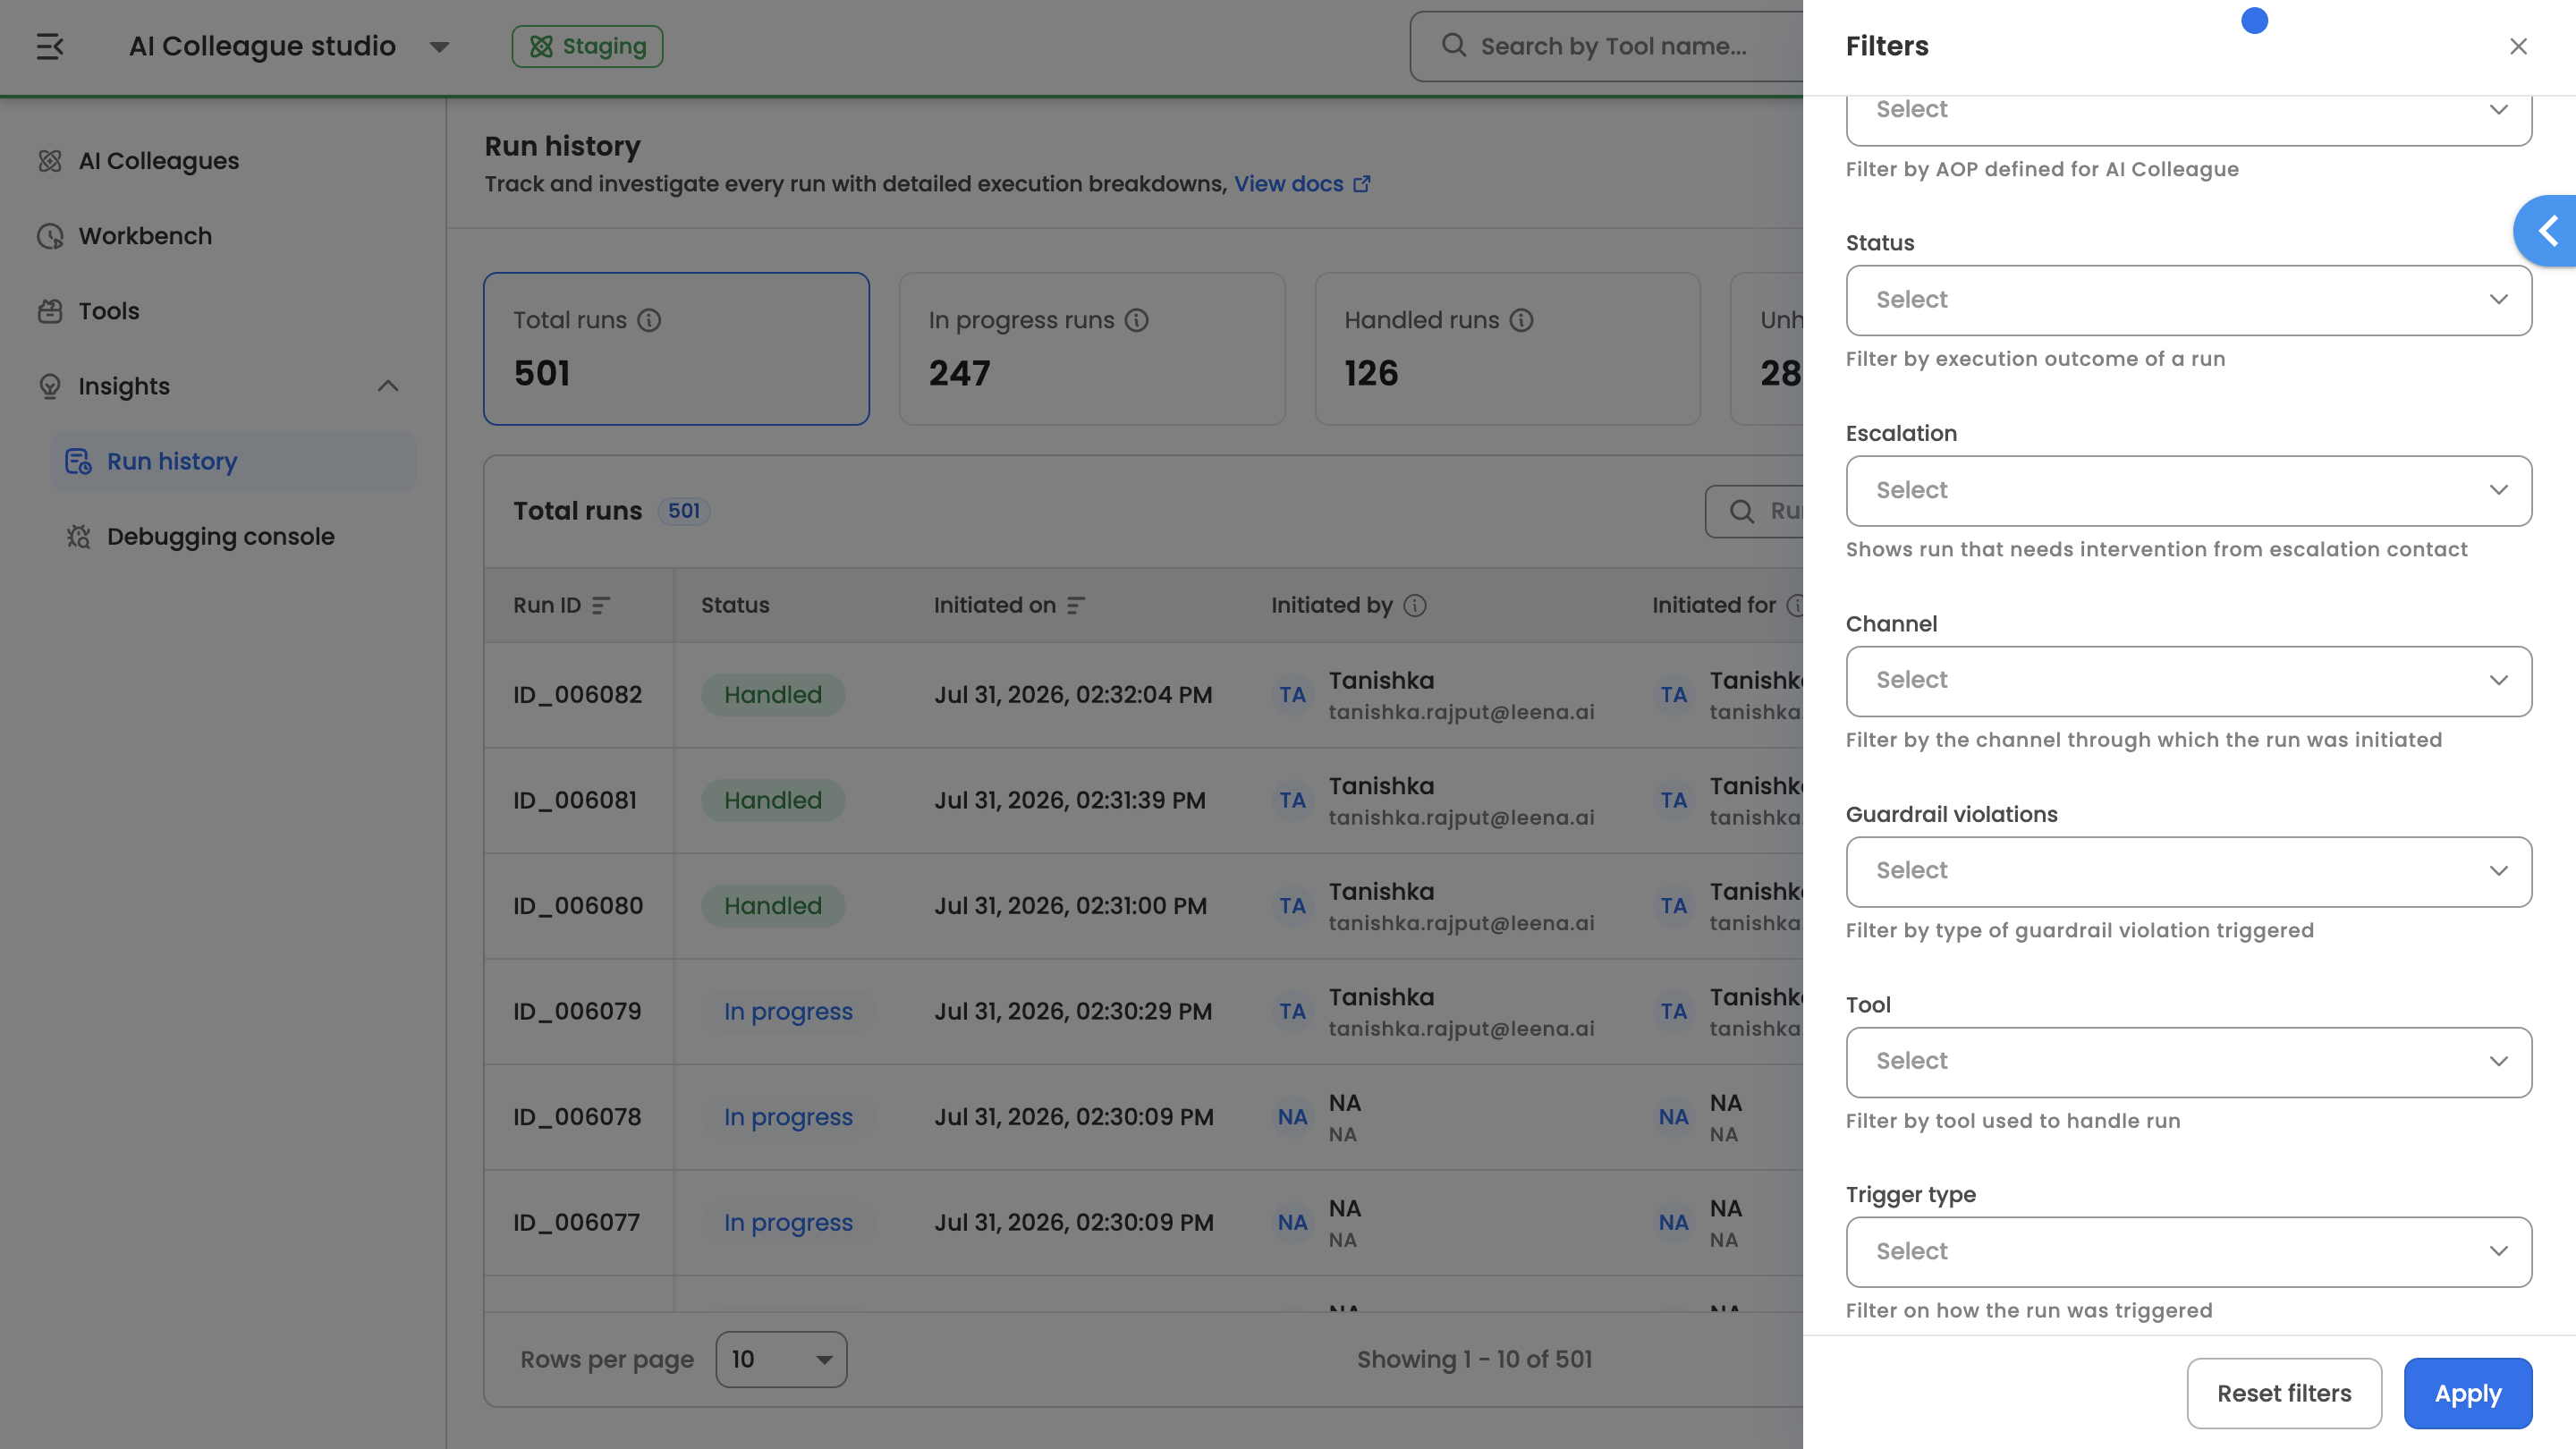
Handled By Filter
Multi-select dropdown to filter by specific AI Colleagues.
- No selection (default): Shows executions from all AI Colleagues
- Select AICs: Quick filter for all AI Colleagues (active/inactive)
AOP Filter
Multi-select dropdown to filter by Agent Operating Protocols.
- No selection (default): Shows all executions
- Select AOPs: Choose specific AOPs that handled one or more runs.
Tool Filter
Multi-select dropdown to filter by Tools.
- No selection (default): Shows all executions
- Select tools: Choose specific tools that handled one or more runs.
Status Filter
Multi-select selection (Select one or more for status specific drill-down):
- No selection (default): All executions
- Handled: Only handled runs
- Unhandled: Only unhandled runs
- In progress: Only in progress runs
- Cancelled: Only cancelled runs
Escalation Filter
Multi-select selection:
- No selection (default): All runs
- Yes: Only runs where escalation occurred
- No: Only runs without escalation
Trigger Type Filter
Multi-select selection:
- No selection (default): All runs
- API: Only runs initiated via API
- Workbench: Only runs initiated via Workbench
- Manual: Only runs initiated manually
Schedule Name Filter
Multi-select dropdown to filter by specific schedule names.
Failure Categories
When an execution fails, the system categorises the failure to aid troubleshooting.
Primary Failure Categories
| Category | Description |
|---|---|
| Out of Scope / Guardrail Violation | Request fell outside the AI Colleague's defined job description or violated guardrail policies |
| Guardrail Violation | Input or output was blocked or flagged by an active guardrail policy (PII Detection, Moderation, or Jailbreak) |
| Tool/AOP failure : execution error | Tool/AOP failed to execute as expected |
NoteFor runs that ended due to a guardrail violation, click into the run to see the dedicated Guardrail Violation step in the execution timeline. It shows which guardrail triggered, what was detected, and the action that was taken.
Cancelling In-Progress Runs
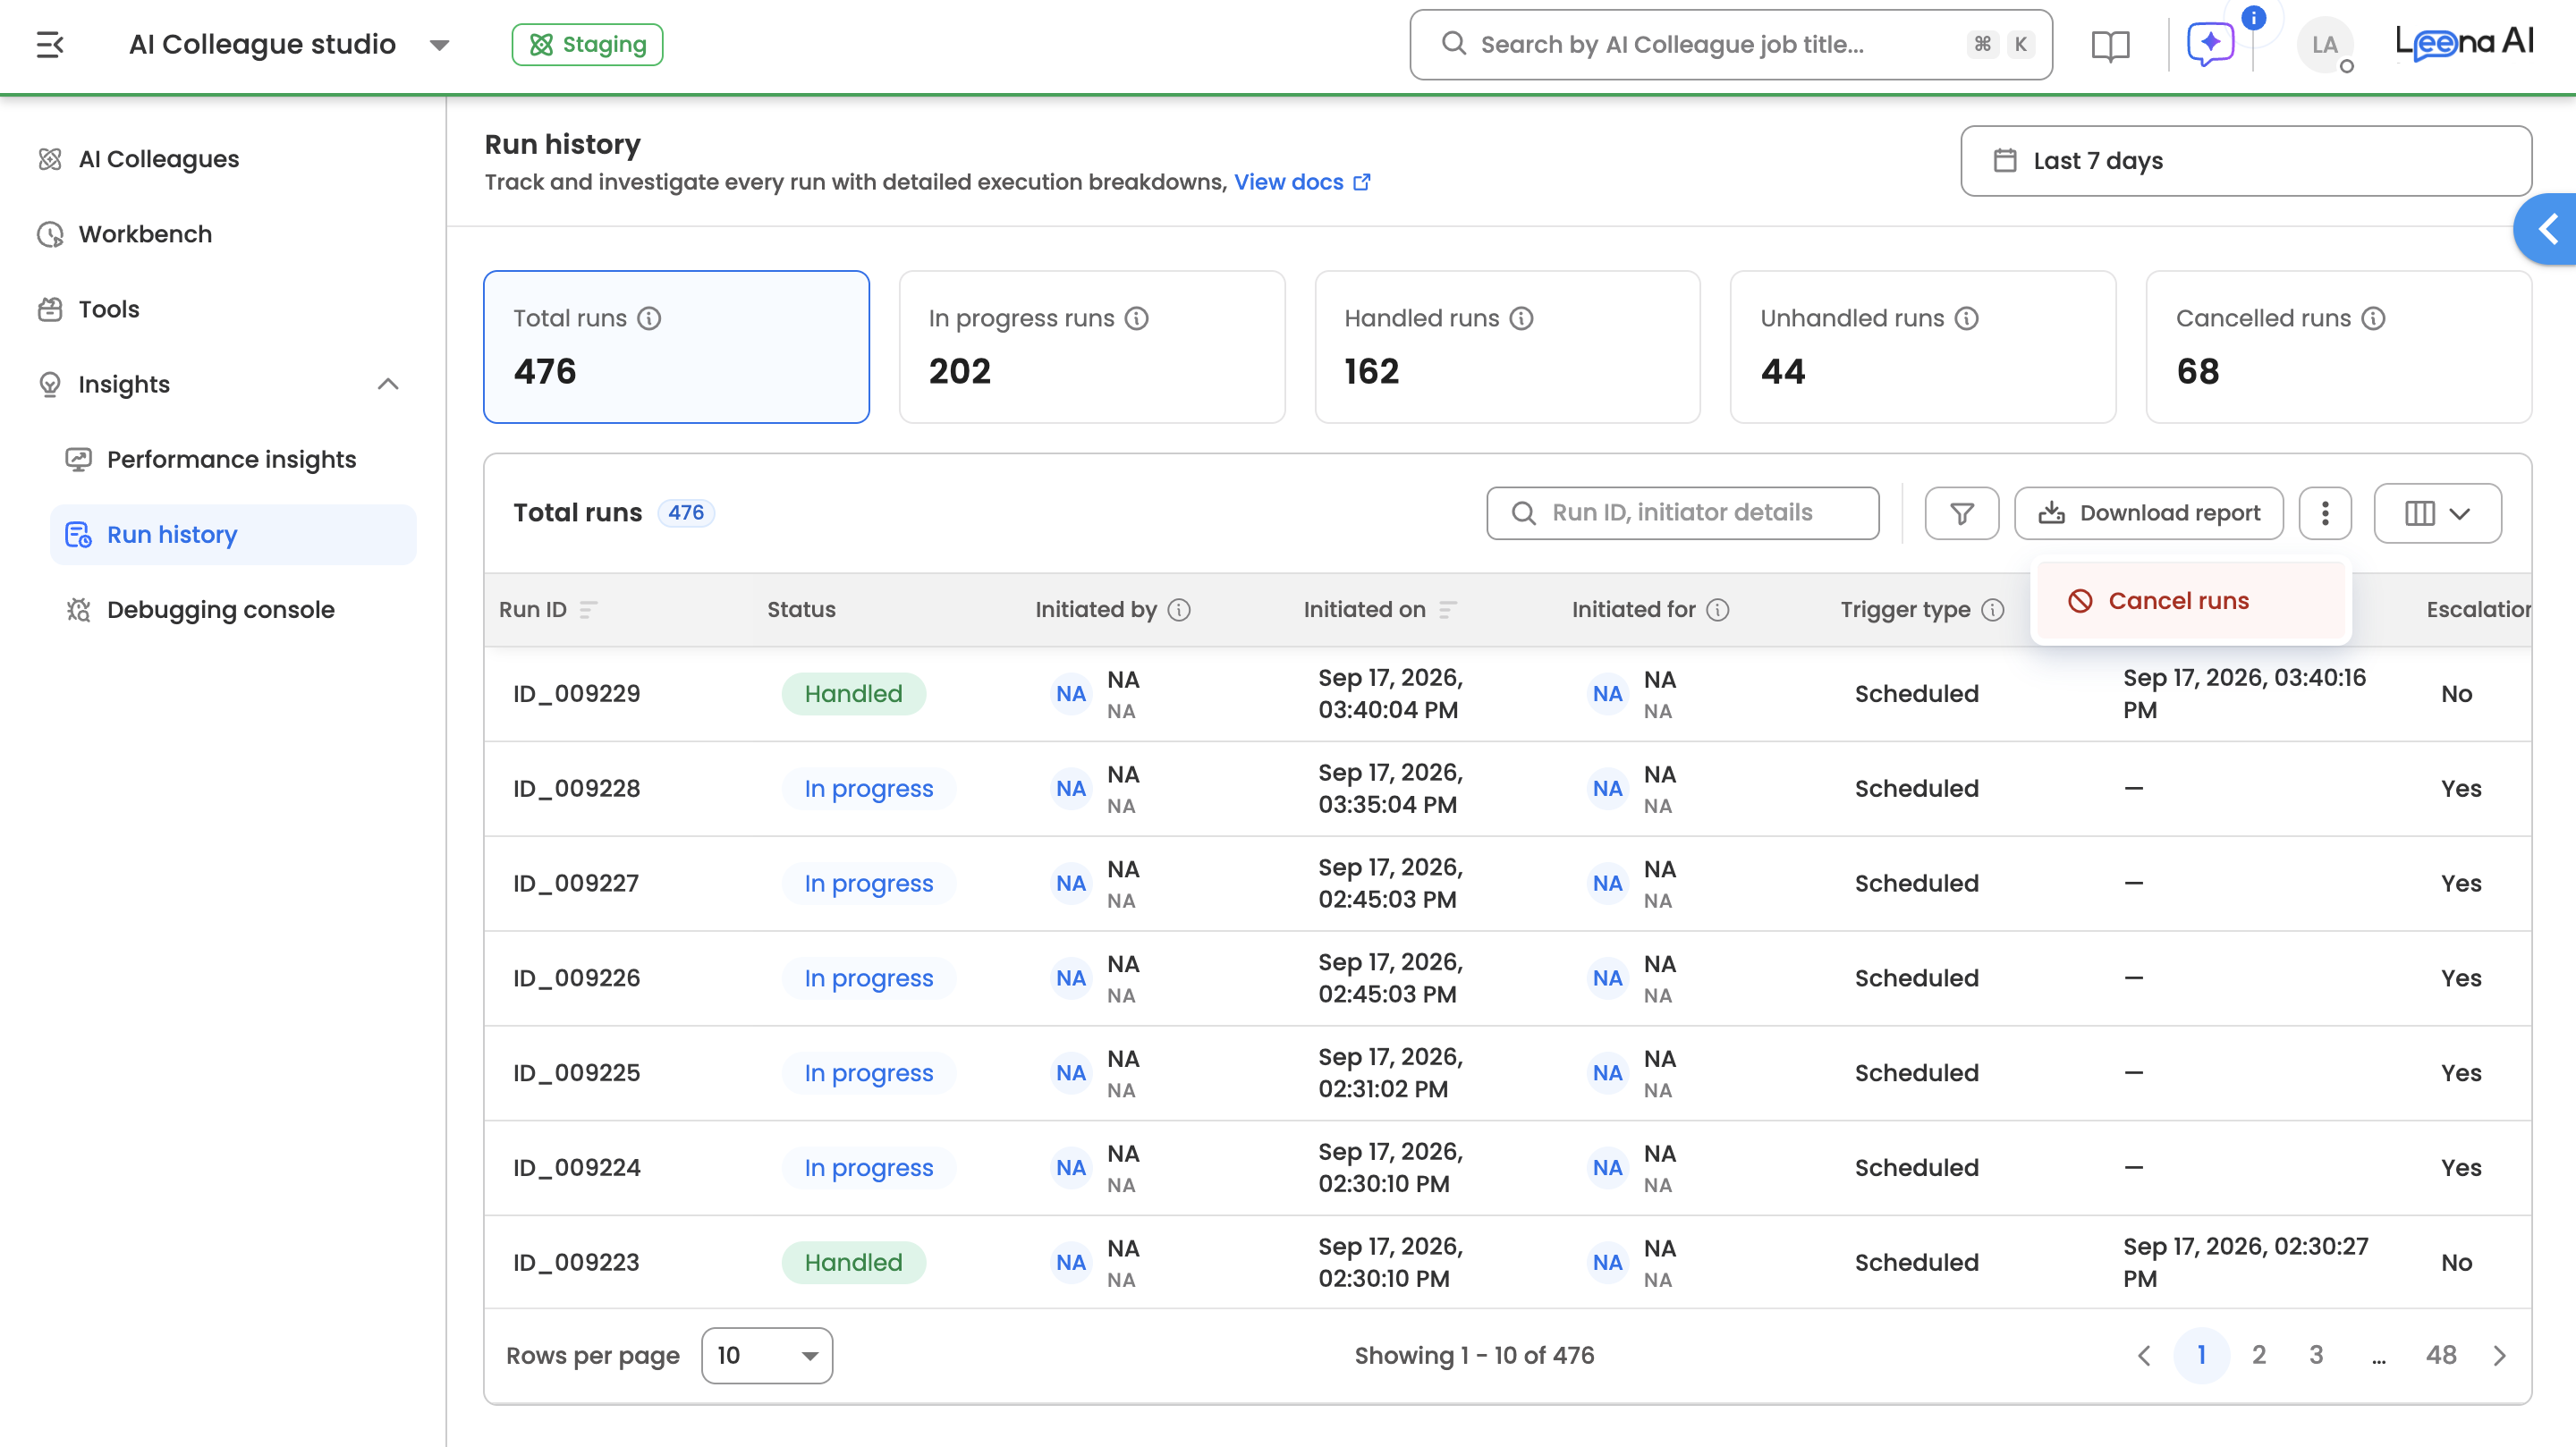
Admins can cancel runs that will never finish — such as scheduled runs stuck waiting on a person — so the In Progress count reflects reality. Only In progress runs can be cancelled, and cancellation requires AI Colleague Admin permission; read-only viewers see the runs but no cancel action.
Ways to Cancel
| Entry Point | How |
|---|---|
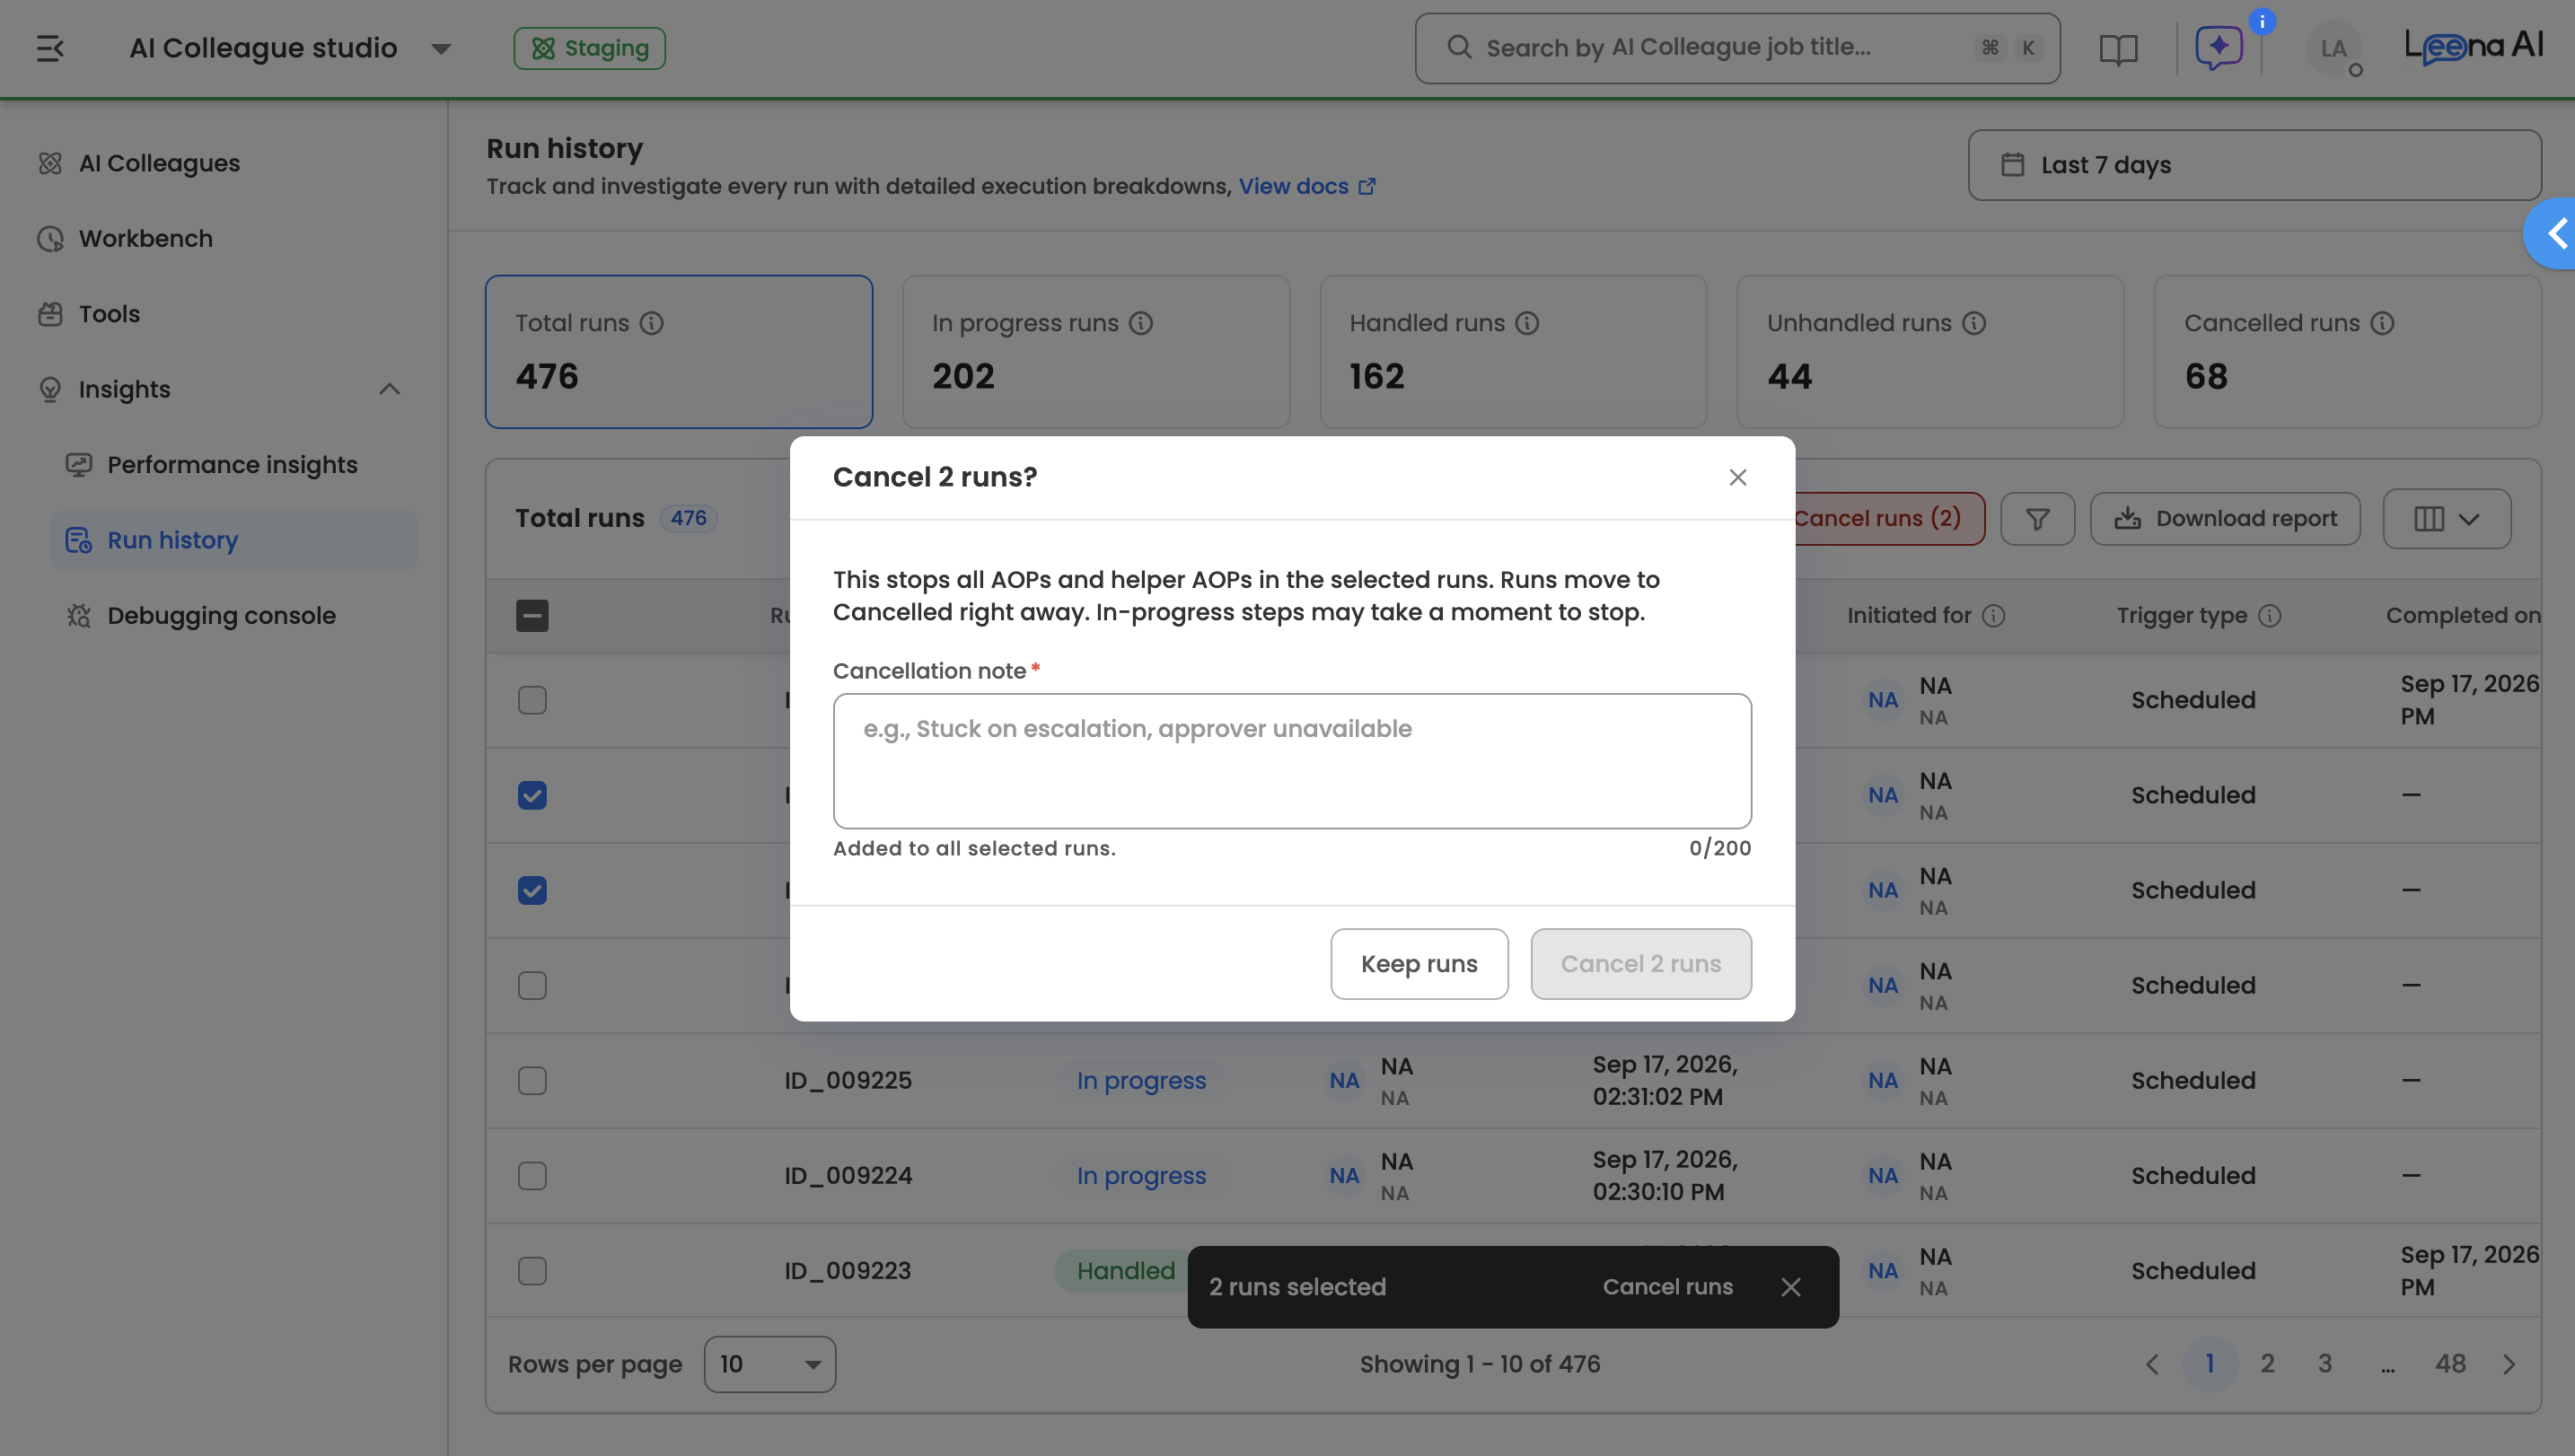
| Bulk — Run History table | Open the table's overflow (⋮) menu → Cancel runs. A checkbox column appears; select the runs (terminal rows are disabled with "Only In progress runs can be cancelled"), then click Cancel runs (N) |
| Single — table row | Open the row's overflow (⋮) menu → Cancel run |
| Single — Execution details | Open the overflow (⋮) menu in the run's header → Cancel run |
Confirmation & Cancellation Note
Cancelling always requires confirmation. The dialog includes a Cancellation note (up to 200 characters) — optional for a single run, required for bulk, where one note applies to all selected runs.
What Happens on Cancellation
- The run moves to Cancelled immediately; in-progress steps may take a moment to stop. Work already completed (tickets raised, emails sent, records updated) is not rolled back.
- Cancellation cascades through nested and helper AOPs, and loops dispatch no further items.
- Users in the run are informed the request was cancelled by an administrator. Pending approvals and input requests are closed server-side — assignees are not notified, but are told the request was cancelled if they act on the card later.
- A cancelled run cannot be resumed or revived; late callbacks and approvals are recorded on the timeline but do not change the run's status.
What Gets Recorded
Cancelled by and the cancellation reason are shown in the run detail header, on hover over the Cancelled chip in the table, and as optional columns (see Additional Available Columns). The run's timeline ends with a "Run cancelled" node carrying the timestamp, actor, and reason. On cancellation, the timestamp populates Completed On, and Total Time Taken is computed from initiation to cancellation.
NoteSystem-generated cancellations (abandonment, cleared chat, guardrail violation) have no "Cancelled by" value — that's how they're distinguished from admin cancellations.
NoteRuns that are part of an evaluation are not eligible for cancellation, as a cancelled run would read as a failed test case.
Participation Coverage
Click the Participation Coverage badge on any row to view all participants involved in that execution.
Participant Categories
| Category | Description |
|---|---|
| Initiated For | The individual or entity this run serves |
| Action Owners | Users assigned approval or input tasks during execution |
| Escalation Contact(s) | Users contacted for exception handling and guidance |
Token Tracking
Run History tracks token consumption for cost monitoring and performance analysis.
| Column | Description |
|---|---|
| Input Tokens | Sum of all input tokens across all LLM calls in the run |
| Output Tokens | Sum of all output tokens across all LLM calls in the run |
Token Aggregation Includes:
- Initial Analysis (re-ranking, shortlisting of AOP/Tool)
- Tools/AOP invocations using LLM
- Any AOP step using LLM processing
Note: Runs without LLM invocations display "NA" for token columns.
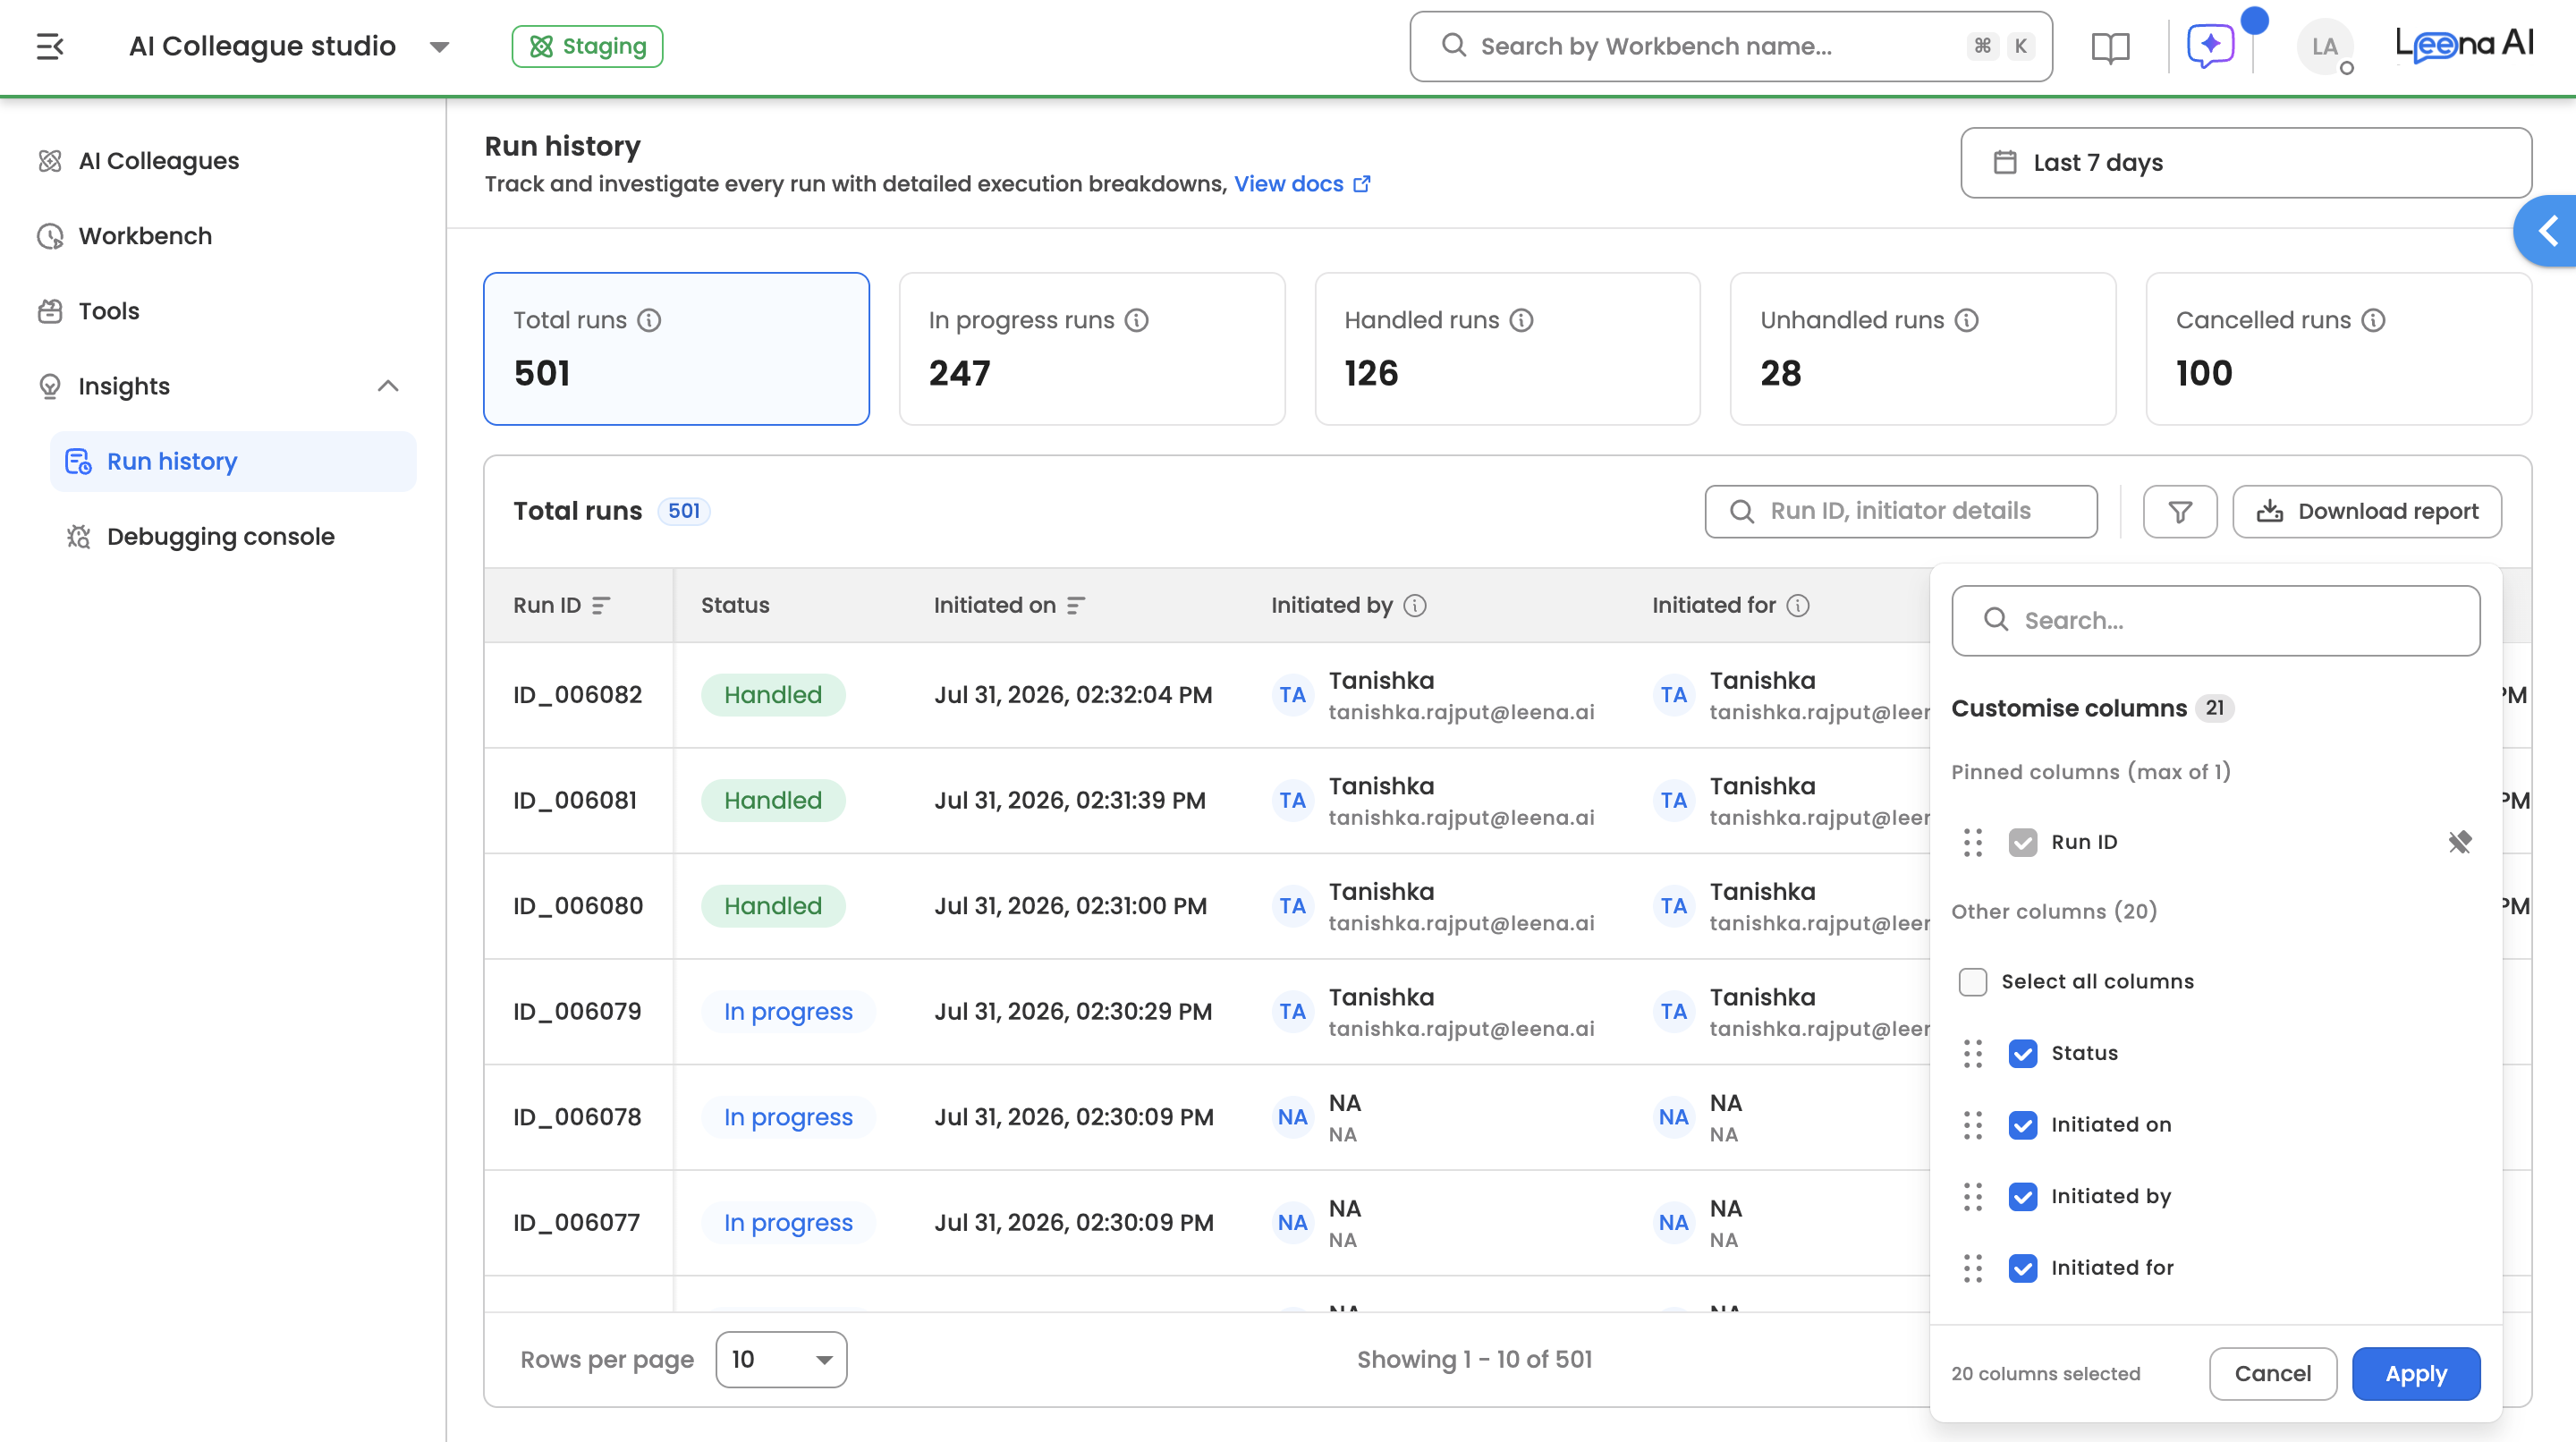
Column Customisation
Manage Columns
- Click the Edit Columns icon next to the table header
- Check/uncheck columns to show/hide
- Changes apply immediately
Reorder Columns
- Drag and drop column headers to reorder
- Column order preferences persist across sessions
Exporting Data
Export Options
| Format | Description |
|---|---|
| CSV (.csv) | Plain comma-separated values |
Export Behaviour
- Exports current filtered and sorted view
- All columns exported (added through managed columns)
- Maximum 10,000 rows per export
- Exports exceeding 10,000 rows generate a .zip file with multiple files
- Share via Email: Option to send export directly to specified recipients
Updated 3 days ago