
Debugging console
The Debugging Console is a technical diagnostic interface within AI Colleagues Studio that provides a forensic, turn-by-turn view of every request processed by an AI Colleague. It exposes the internal decision-making of the Master Orchestrator — including tool discovery, tool reranking, LLM reasoning, additional instructions injected at runtime, and the final processed message sent to the user — so that support engineers, QA, and implementation teams can understand exactly why the AI Colleague behaved the way it did for any given conversation turn.
This guide is for enterprise administrators, support and QA teams, and implementation partners investigating specific AI Colleague interactions — for example, validating why a particular tool was or was not invoked, why a tool was reranked out, or why the AI Colleague produced a particular response.
Key Capabilities
- Per-request timeline — View a chronologically ordered log of every event that occurred during a request, from user input through LLM reasoning to the final processed output.
- Tool call visibility — Inspect the full tool inventory available before reranking, the reranker's scoring and cutoff decisions, and the final set of tools passed to the LLM after reranking.
- LLM reasoning transparency — See the model's reasoning trace alongside the toolset and additional instructions that were in context at the time of the decision.
- Cross-channel coverage — Filter requests by the channel the conversation originated from (Web app, Slack, Sms, Evaluation, System).
- Direct lookup by Request ID or User ID — Paste any Request ID (e.g.
Req_69eed72099ce1f6579c6296f) or User ID into the search bar to jump straight to the relevant conversation.
How to Access the Debugging Console
- Log into the Leena AI platform and select AI Colleagues from the main navigation.
- Open the AI Colleague you want to investigate.
- In the left sidebar, expand Insights and click Debugging Console.
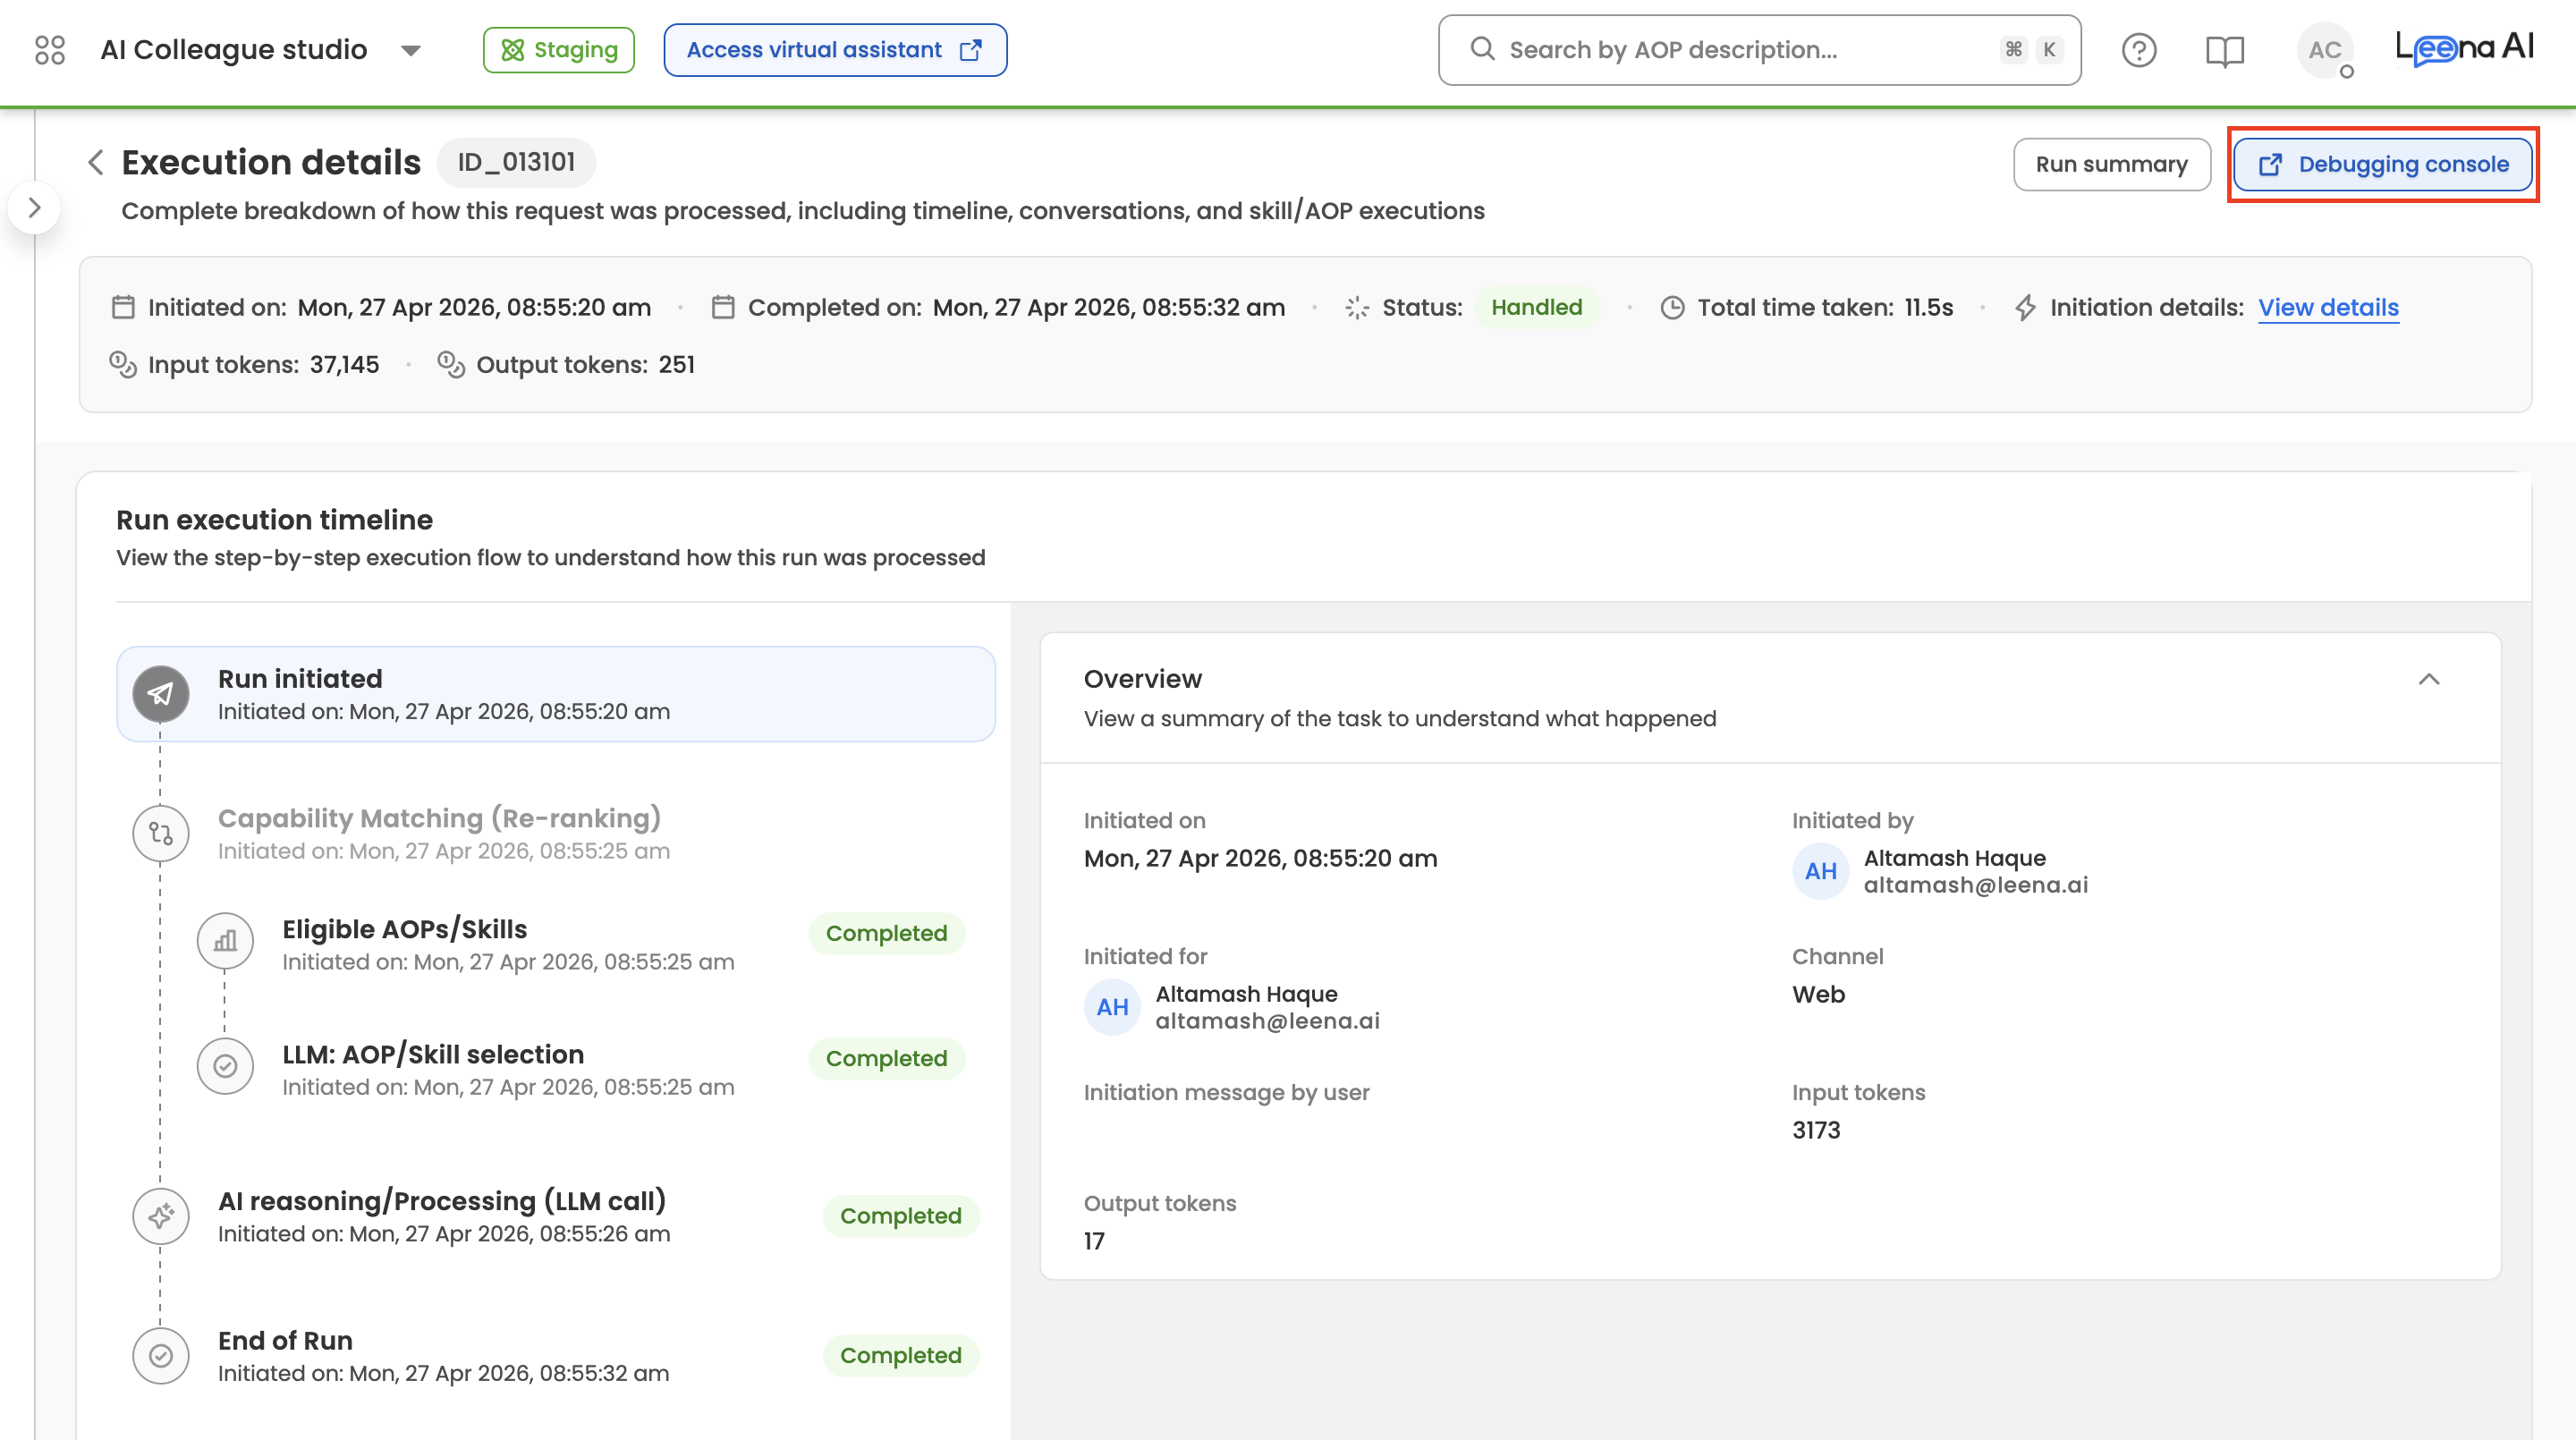
You can also access it directly from the Run Execution Details page — clicking Debug on any request opens that request in the Debugging Console, pre-filtered to its Request ID.
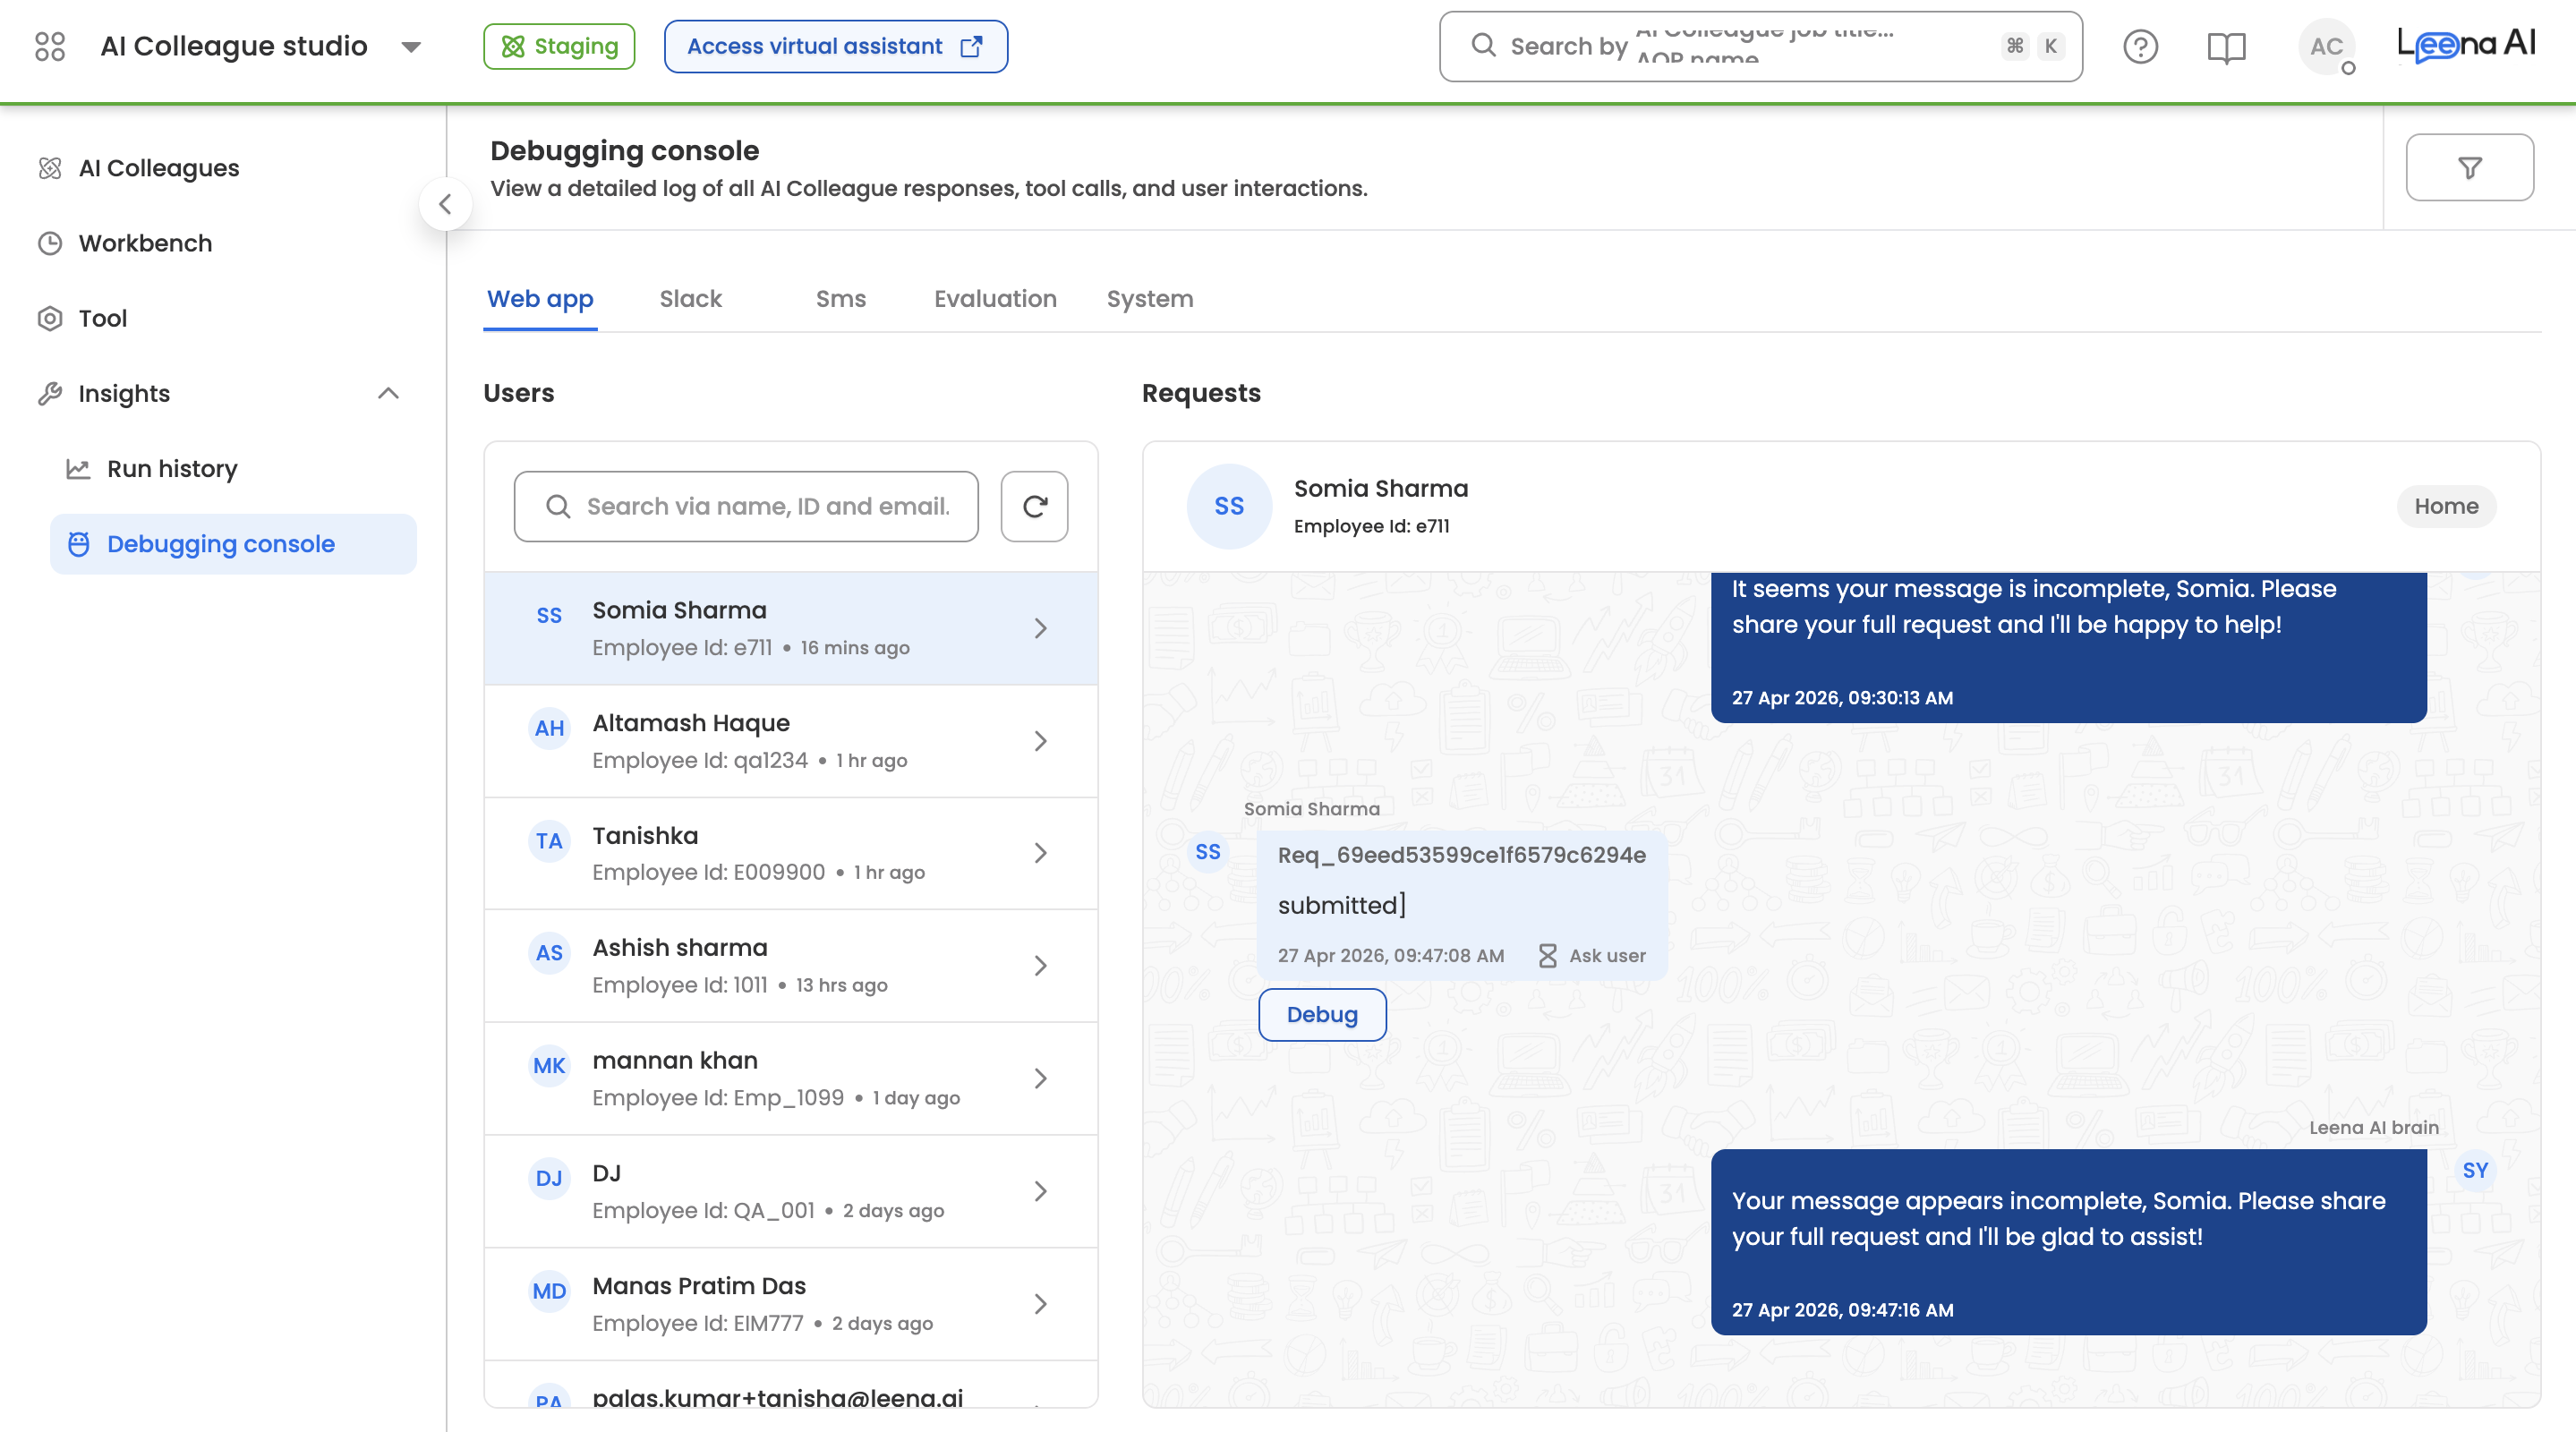
Understanding the Interface
The Debugging Console is organized into three zones: a channel tab bar, a two-pane conversation browser, and a request detail panel.
Channel Tabs
At the top of the console, channel tabs let you scope the view to requests that originated from a specific channel. The available channels are:
- Web app — Conversations from the employee-facing web widget and virtual assistant.
- Slack — Conversations routed through the Slack integration.
- Sms — Conversations through the Twilio SMS channel.
- Evaluation — Requests generated by Eval Runs against the AI Colleague.
- System — Internal system-initiated requests (for example, Workbench-scheduled AOP runs).
The tab you select determines which users and requests appear in the panels below.
Users Panel
The left pane lists all users who have interacted with the AI Colleague on the selected channel, sorted by most recent activity. Each user entry shows their display name and Employee ID.
- Home grouping — By default, requests are grouped under the user's Home conversation (the primary thread where no dedicated conversation context exists). Each conversation card shows the relative time of the last request (for example, "1 hr ago") and the number of requests in that conversation.
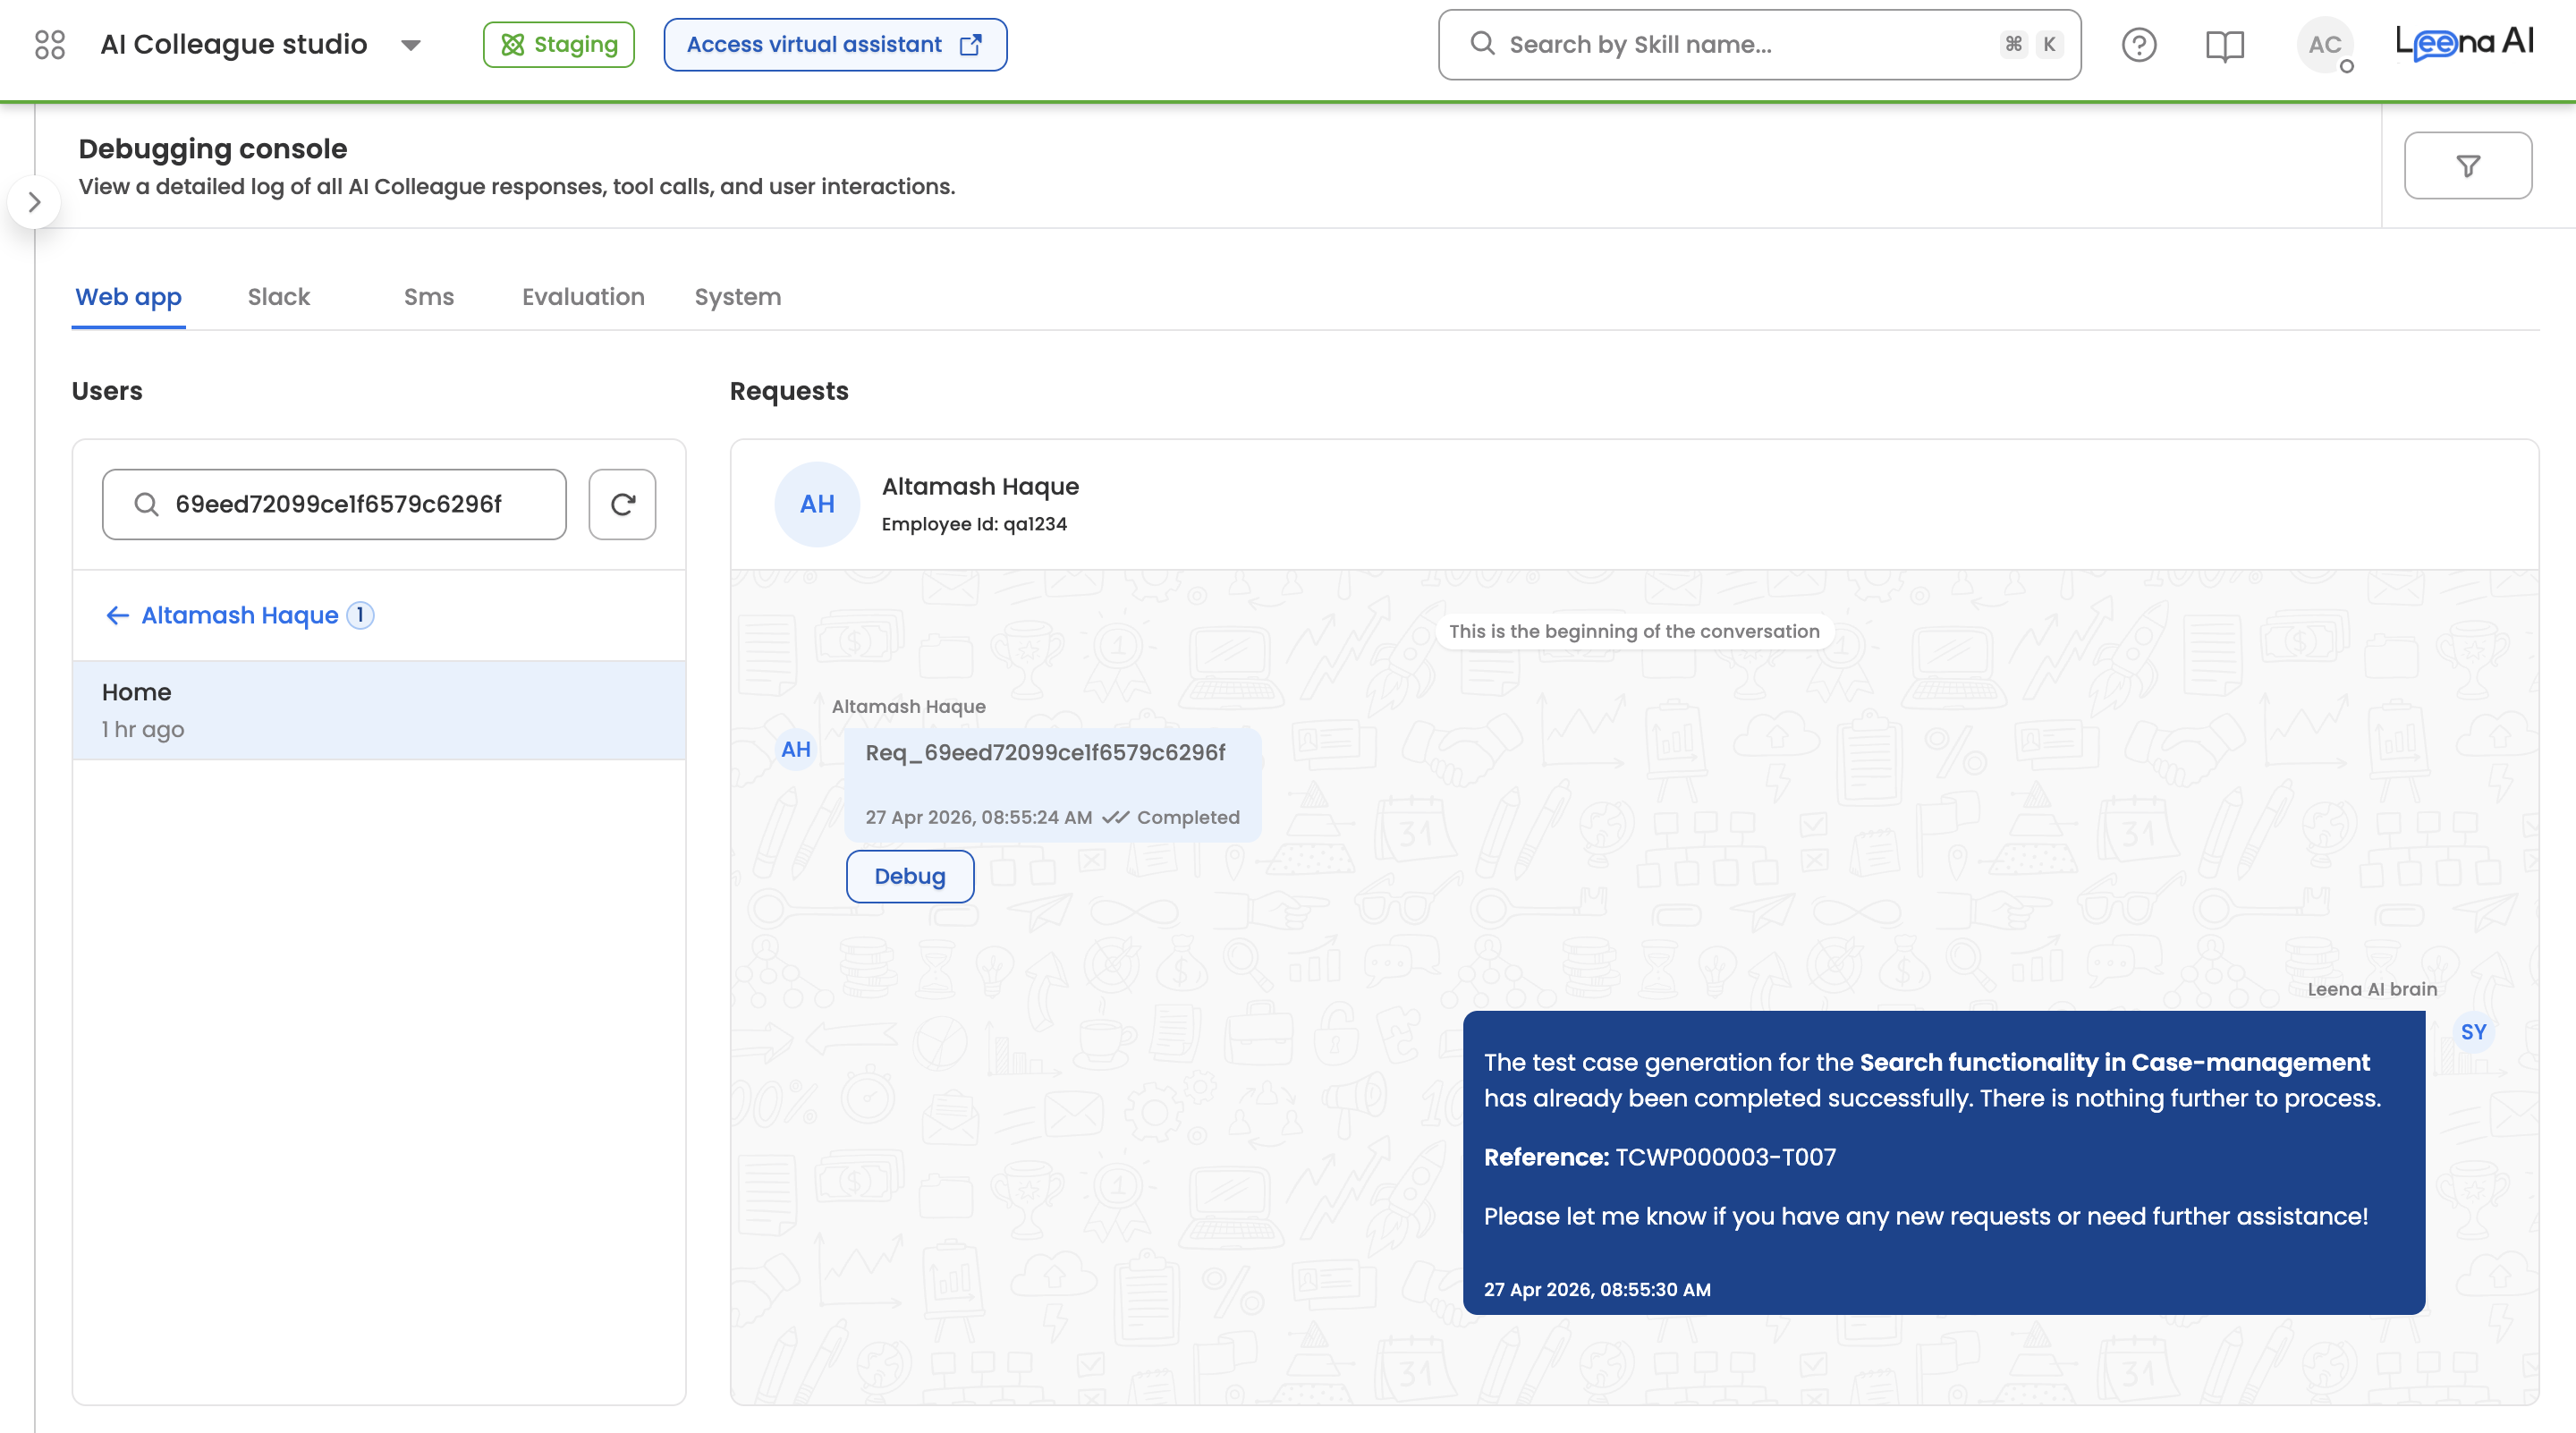
- Search — The search bar accepts two input types:
- A User ID to filter the user list.
- A Request ID (starting with
Req_or a raw ObjectId) to jump directly to the specific user and conversation that contains that request.
- Refresh — Use the refresh icon next to the search bar to reload the user list with the latest activity.
Requests Panel
The middle pane shows the selected user's conversation as a chat transcript. Each user message is annotated with:
- The Request ID (for example,
Req_69eed72099ce1f6579c6296f). - The user input text as it was received.
- A timestamp and delivery status (Completed, In Progress, or Failed).
- A Debug button to open the request detail panel.
The AI Colleague's response appears on the right side of the transcript, exactly as it was rendered to the end user.
Request Detail Panel
Clicking Debug on any request opens the Request Detail Panel on the right side of the console. This panel lists every event that occurred during the processing of that request, in chronological order, with timestamps. The following information is surfaced:
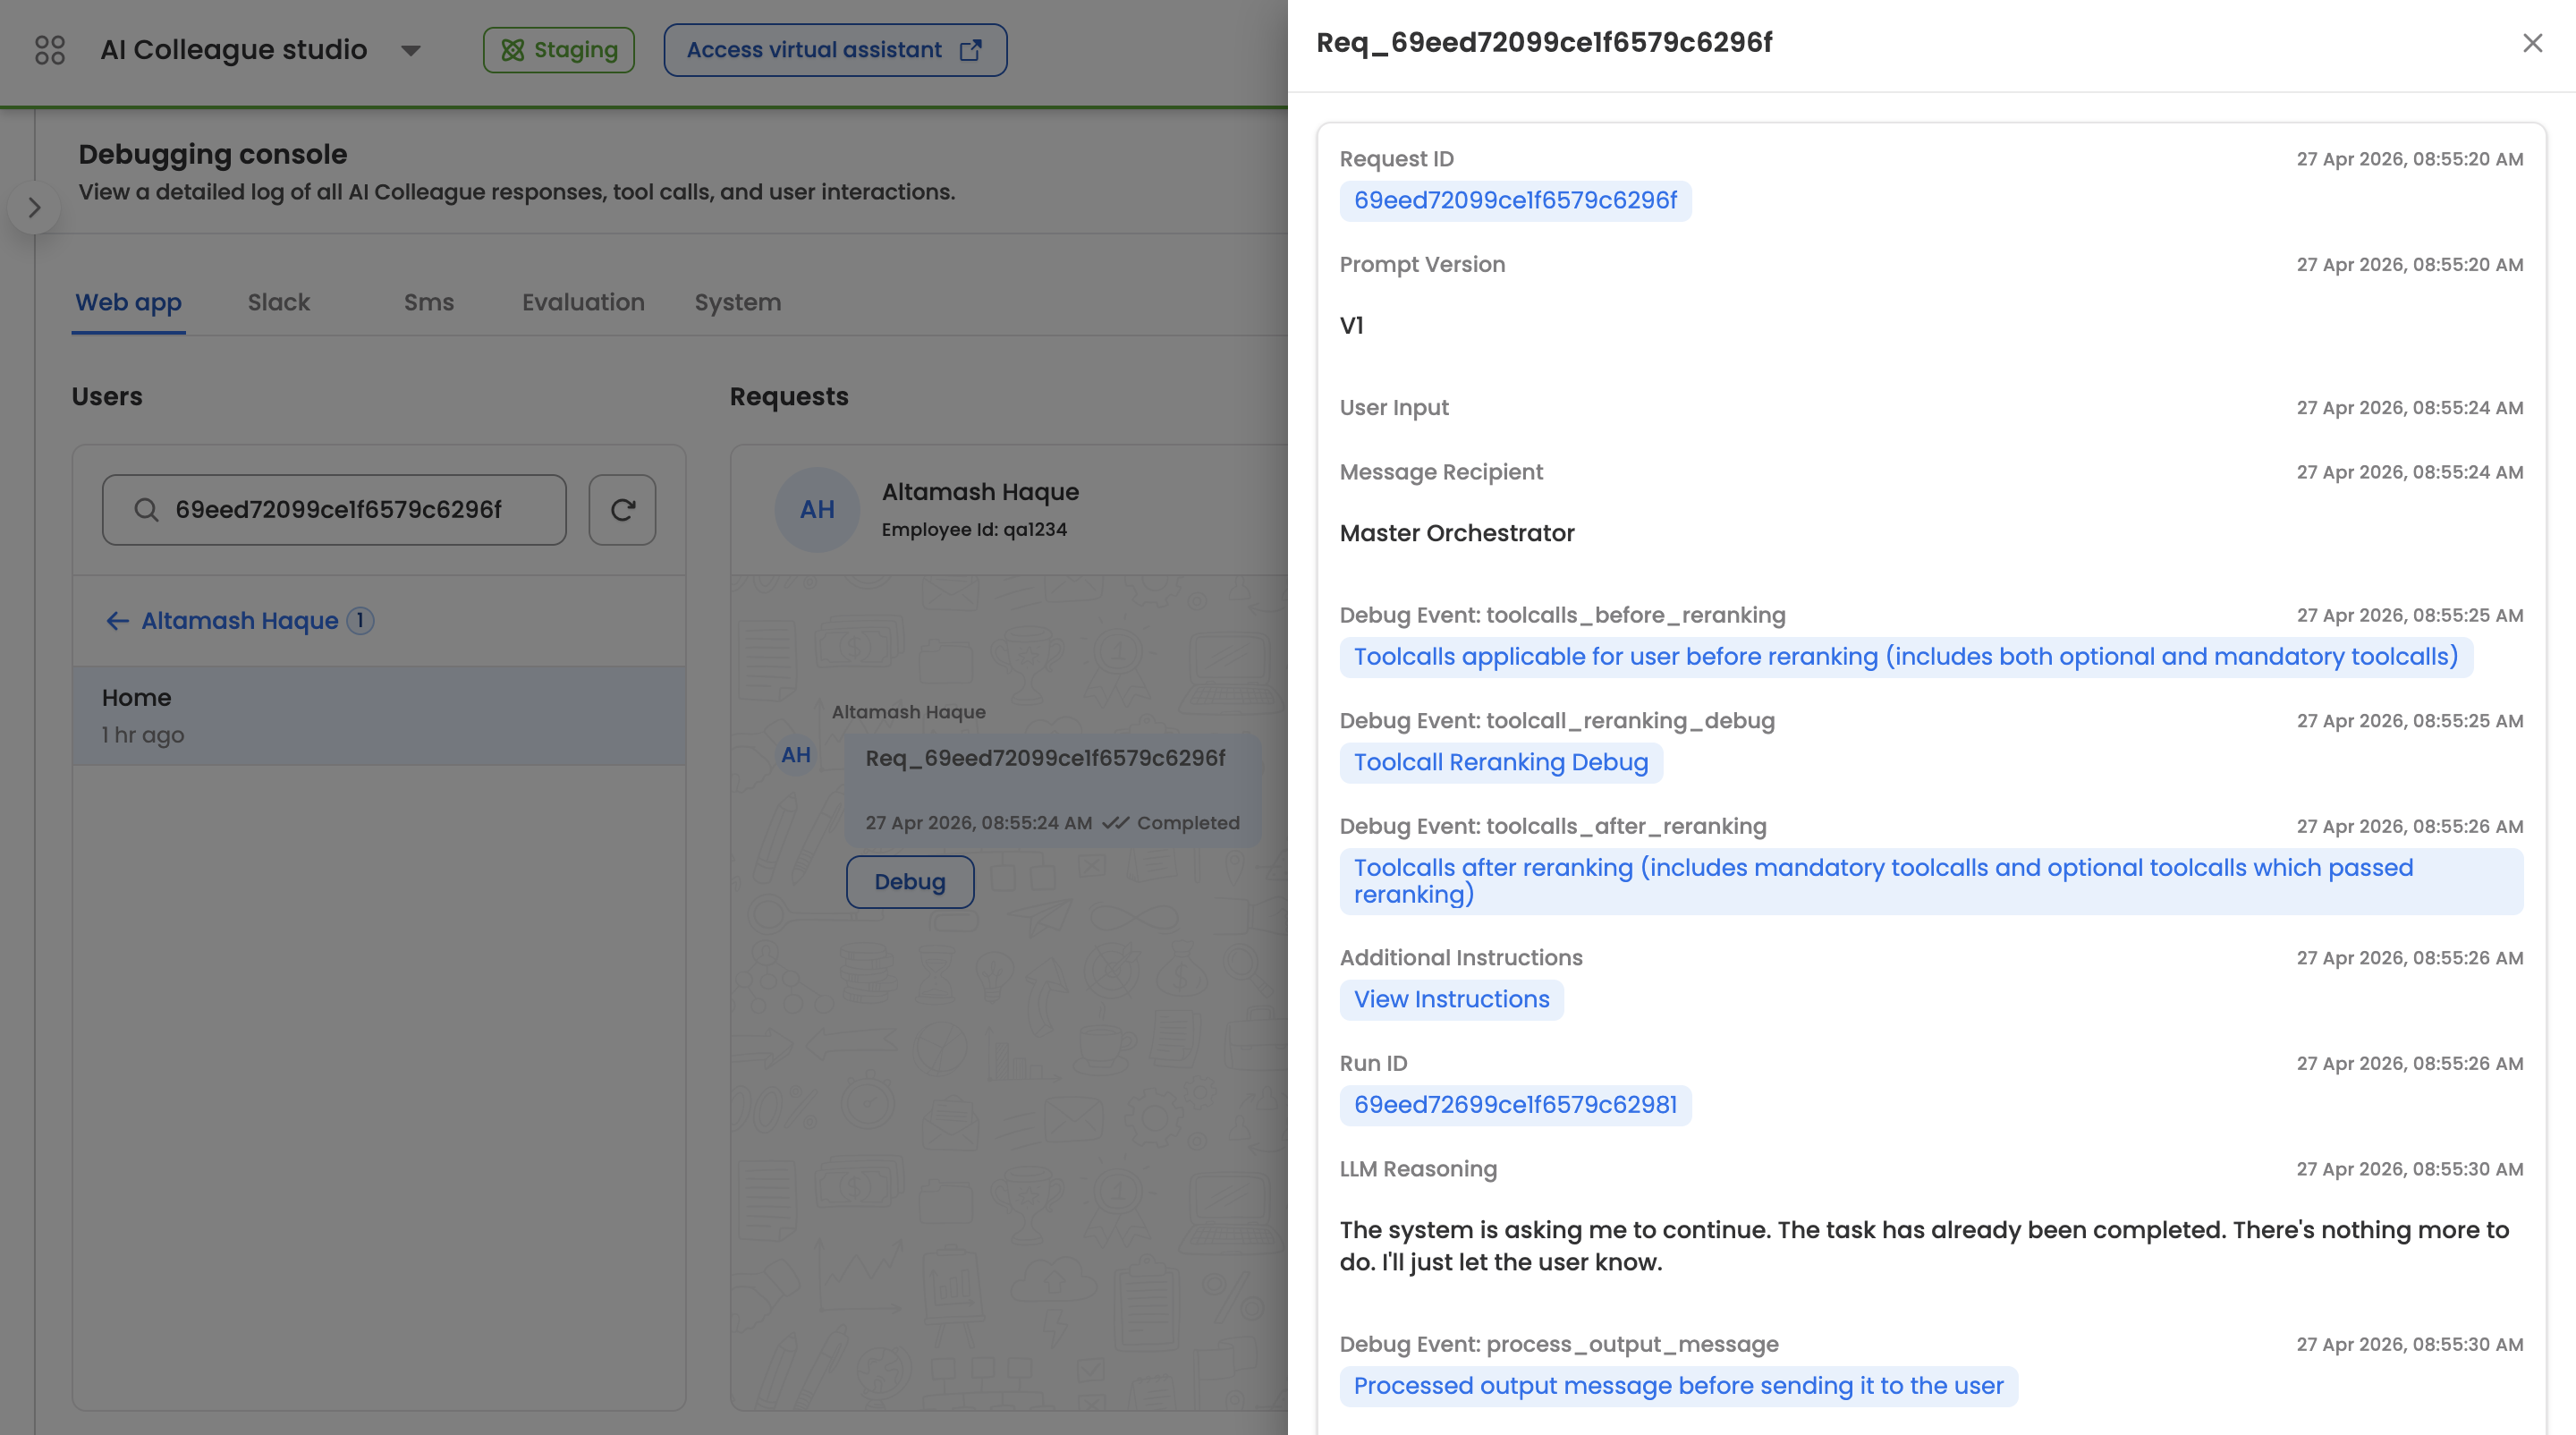
- Request ID — The unique identifier for this request.
- Prompt Version — The version of the orchestrator prompt template used (for example,
V1). - User Input — The raw text received from the user.
- Message Recipient — Which component handled the request. Resolves to Master Orchestrator for the main assistant,
AOP - <aop name>when an AOP is executing the request (for example,AOP - Leave Processor), or other assistant types such as Form Assistant for form-driven flows. - Debug Event: toolcalls_before_reranking — The complete set of tool calls that were applicable to the user before reranking was applied. Includes both mandatory tools and the full pool of optional tools the orchestrator considered. Click through to view the full list and associated metadata.
- Debug Event: toolcall_reranking_debug — The reranker's per-tool scoring output, including the reranking query used, each candidate tool's relevance score, the positive and negative score cutoffs applied, and the count of tools before and after reranking.
- Debug Event: toolcalls_after_reranking — The final tool set actually exposed to the LLM, combining the reranked optional tools and all mandatory tools (case management, always-use, must-have).
- Additional Instructions — Any instructions dynamically injected into the prompt at runtime (for example, current timestamp, user profile, FAQ context). Click View Instructions to expand the full payload.
- Run ID — The identifier of the underlying execution run (for example,
69eed72099ce1f6579c6296f). Useful for cross-referencing with Run Execution Details. - LLM Reasoning — The orchestrator's internal reasoning trace explaining why it chose the action it did.
- Tool Call Execution — Each tool invocation that ran during the request, with its arguments and result, rendered as clickable entries for drill-down.
- Debug Event: process_output_message — The processed output message immediately before it was dispatched to the user, after any post-processing, redaction, or formatting had been applied.
For requests that trigger AOP execution, additional events appear in the timeline:
- AOP Step Started / Ended / Paused — Lifecycle markers for each step of the AOP being executed.
- Handover Message — When the request is handed over to a different AIC or the Escalation Manager, the handover payload is logged.
Typical Debugging Workflows
Why didn't my tool get called? Open the request, then compare Debug Event: toolcalls_before_reranking against Debug Event: toolcalls_after_reranking. If the tool is present in "before" but missing in "after," open Debug Event: toolcall_reranking_debug to see its reranker score and compare it against the cutoff. This tells you whether the issue is tool discovery (description or example-query quality) or reranker scoring.
Why did the AI Colleague refuse or respond unexpectedly? Read the LLM Reasoning field alongside Additional Instructions and Debug Event: toolcalls_after_reranking. This tells you what the model saw in context when it produced its response and why it chose that path.
Did the right tool get called with the right arguments? Scroll down to the Tool Call Execution entries in the timeline. Each entry shows the tool name, the arguments the LLM supplied, and the result returned.
Was the output modified before reaching the user? Compare the raw LLM response in the timeline against Debug Event: process_output_message. Any difference reflects post-processing — formatting, guardrails enforcement, or redaction.
Related
Updated about 1 month ago