
Stage 4 — OPERATE (Monitoring in Production)
UAT tells you the AIC is ready for production. This guide tells you how to keep it healthy in production. It walks you through the seven things you need to put in place from day one of go-live — so that when something degrades, you catch it before an end user does, and when something breaks, you can diagnose it in minutes rather than hours.
This guide is for anyone responsible for a live AIC — platform admins, IT Ops teams inheriting the AIC from the build team, CoE leads running a portfolio of AICs, and the business owner who signed up for a success metric. It assumes the AIC, its AOPs, Tools, KM sources, Workbenches, and guardrails are already deployed and serving real traffic. If you are still in UAT, see the Planning UAT Testing guide instead.
Before you start: what production monitoring actually covers
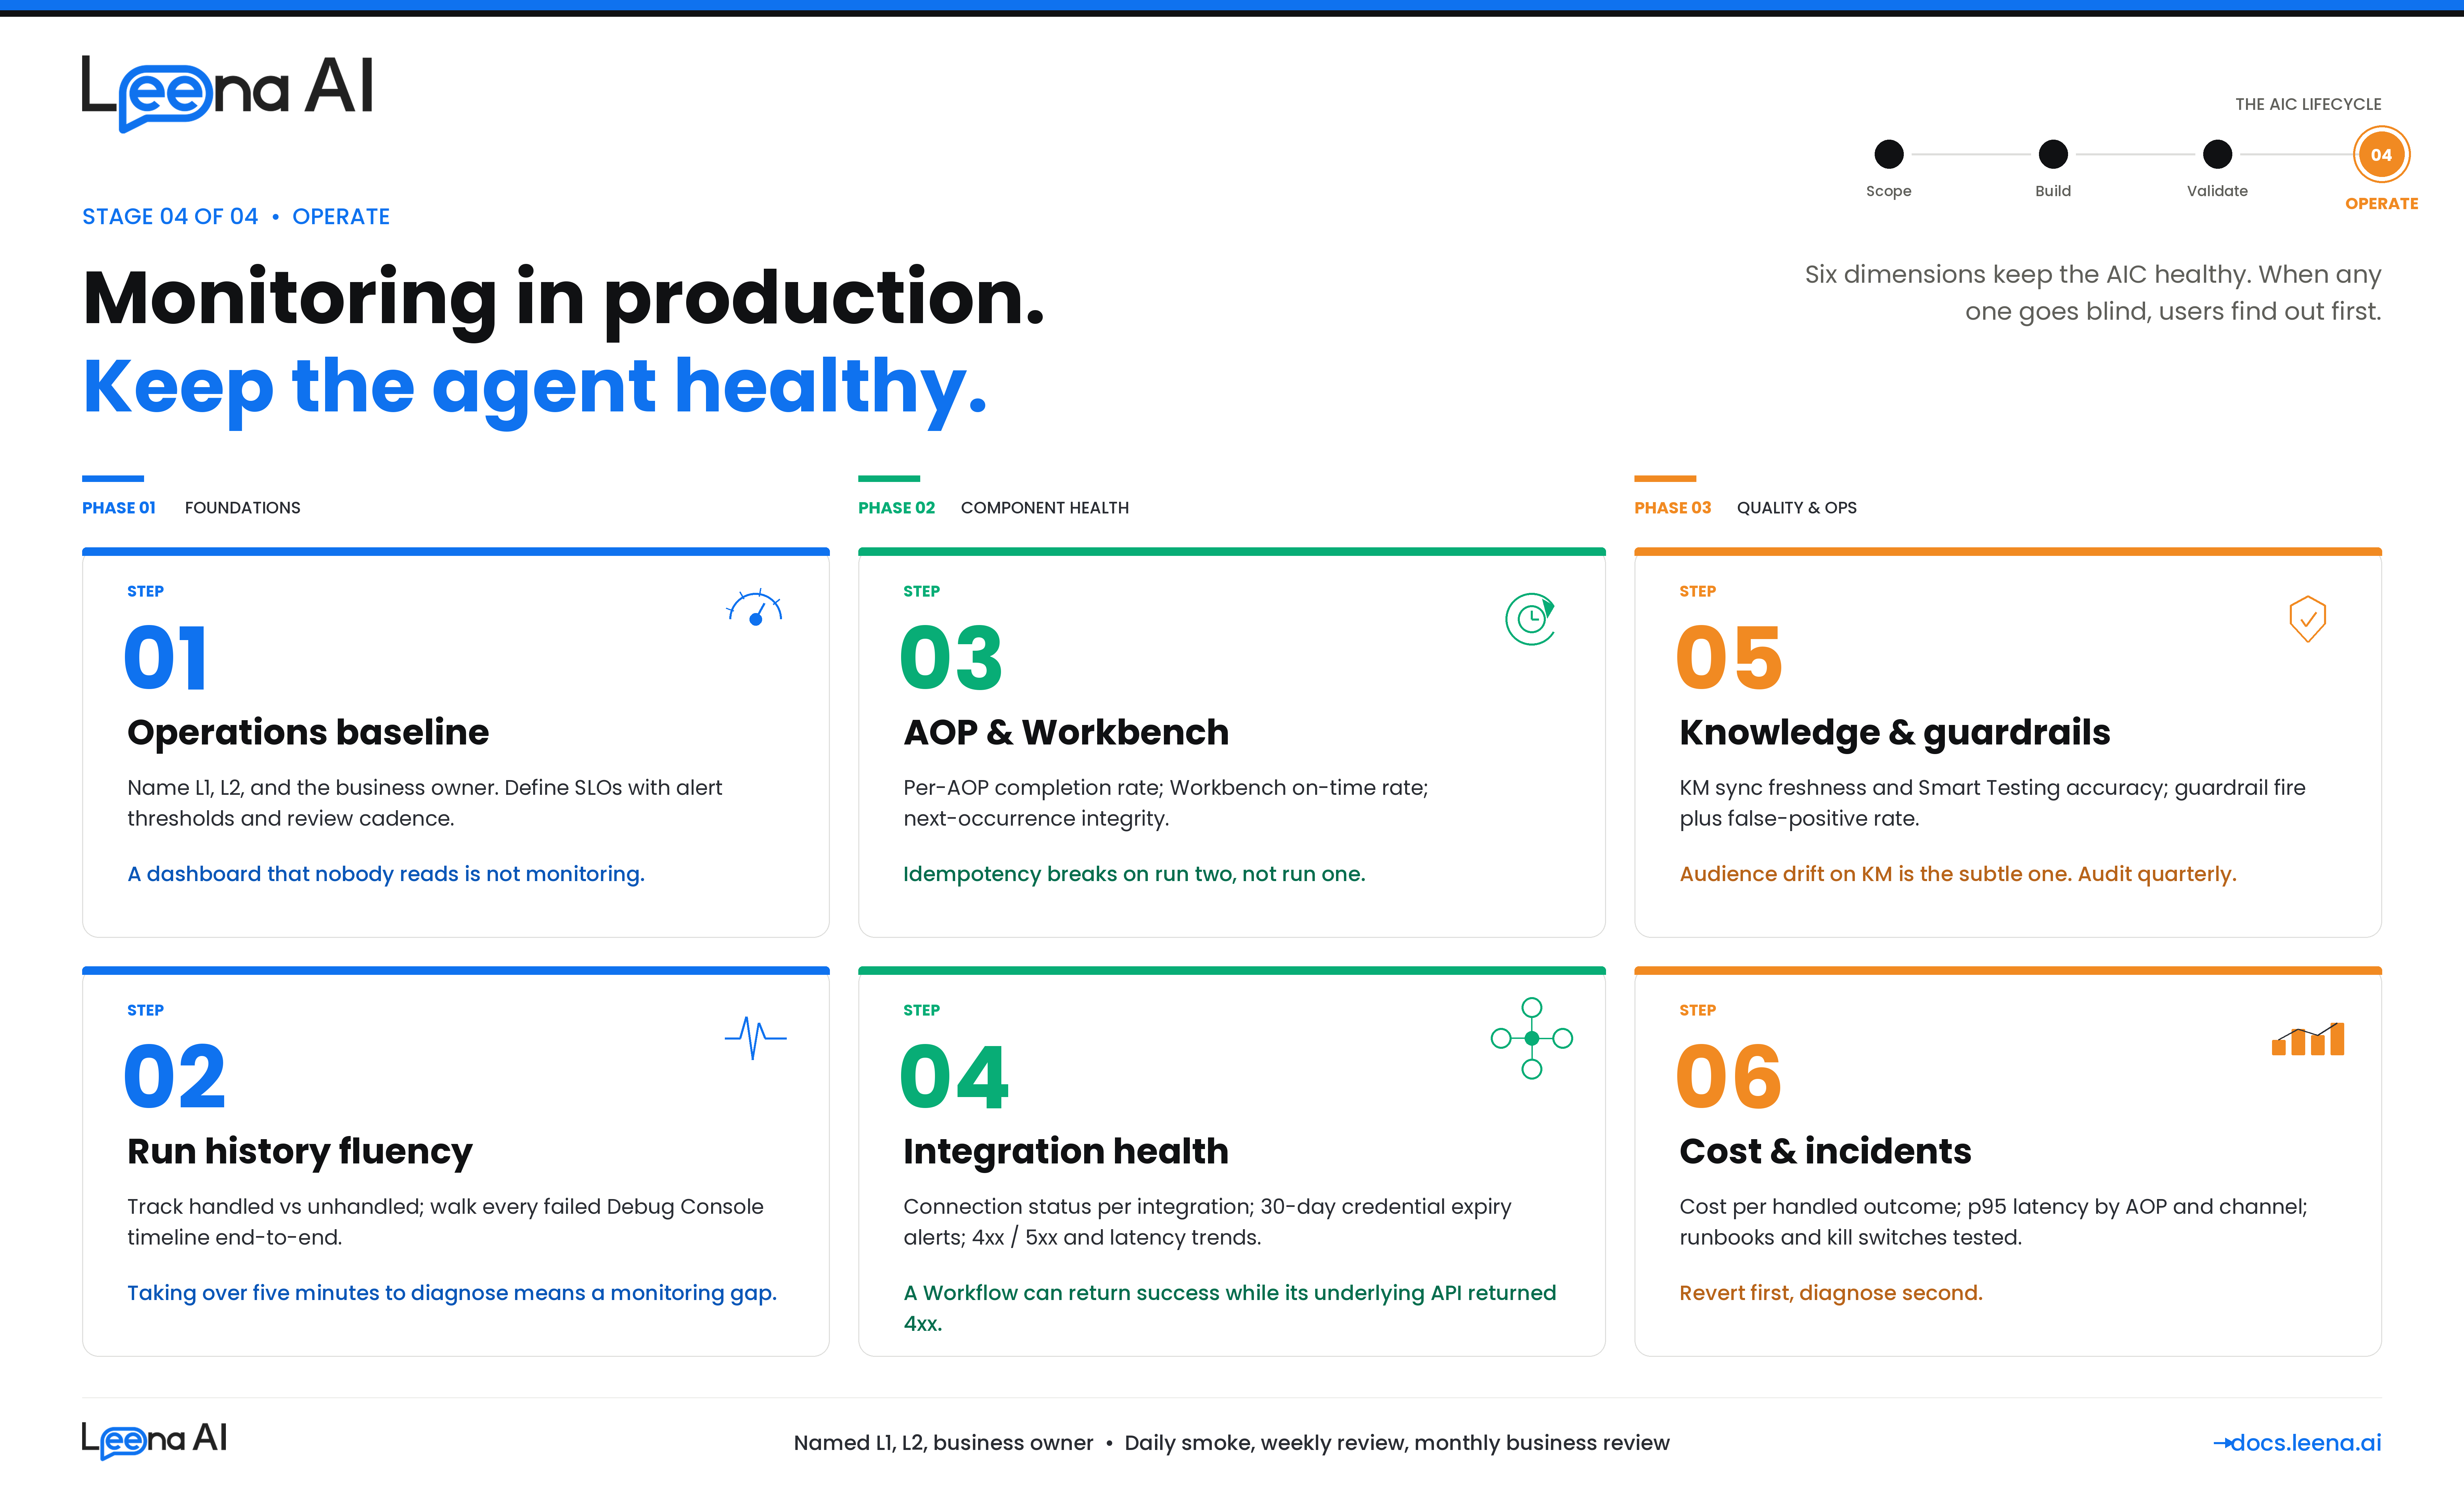
A working AIC in production has to hold up across six dimensions at once. Every alert, dashboard, and review cadence in this guide maps back to one of them — if your monitoring stack does not answer at least these six questions daily, it has a blind spot.
| Dimension | What you're watching for | Where it lives in the product |
|---|---|---|
| Functional health | Are AOPs completing successfully? Is the handled/unhandled split moving in the wrong direction? Are tool calls succeeding at expected rates? | AIC Studio → Run History; Debugging Console; Analytics → Bot Performance |
| Integration health | Are third-party systems reachable? Is credential / OAuth token expiry on the horizon? Are outbound calls failing, slow, or returning unexpected payloads? | Operations → Integration Execution Logs; Integrations → Critical Alerts; Integrations → Credential Monitor |
| Knowledge quality | Are KM sources syncing cleanly? Are articles stale? Is the AIC retrieving and citing the right articles for the right audiences? Is grounding degrading as content drifts? | KM → Health Dashboard; KM → Sync Logs; KM → Smart Testing; Run History (per-run KM citations) |
| Governance | Are guardrails firing where they should (PII, toxicity, jailbreak, moderation)? Is audit capture intact? Are guardrails not firing on benign traffic (false positives)? | Run History (guardrail timeline items); Guardrails configuration dashboard; Audit Logs |
| Autonomy & scheduling | Are Workbench-scheduled AOPs firing on time? Are they double-executing, silently missing, or running too long? Are scheduled runs idempotent under retry? | AIC Studio → Workbench; Run History (filter by scheduled actor); scheduler logs |
| Cost & performance | What is token spend per AIC, per AOP, per run? Are latencies within SLO? Is concurrency growing faster than capacity? | AIC Studio → Run Insights (token attribution); Analytics → Session Metrics; APM/OTel traces |
Any degradation in production almost always traces back to exactly one of these six. The rest of this guide is how you instrument, alert on, and review each of them.
Step 1 — Stand up the monitoring baseline
Before you open any dashboard, confirm the monitoring stack itself is in place and staffed. A dashboard no one looks at is not monitoring.
Questions to answer
- Who owns this AIC in production? There must be a named Level-1 responder (IT Ops or the CoE), a Level-2 escalation (the build team or platform admin), and a business owner who holds the success metric. Without all three, nothing gets fixed fast enough.
- What are the SLOs? AOP completion rate, tool call success rate, p95 latency, KM sync freshness, scheduled-run on-time rate, guardrail coverage. Each needs a target, a threshold for alerting, and a review cadence.
- Where are alerts routed? Slack channel, PagerDuty / Opsgenie, email distribution list — different severities to different destinations. Do not mix P1 pages with informational emails.
- What is the review cadence? Daily smoke check (10 minutes), weekly operational review (30 minutes), monthly business review with the sponsor (performance against the success metric from the original scope card).
- Who has access to which surfaces? RBAC matters — Run History, Debugging Console, Integration Execution Logs, and KM Health Dashboard each have their own capability gates. Confirm L1 responders can actually reach the tools they need without asking for access during an incident.
Dashboards every in-production AIC needs
The Unified Dashboard provides the surfaces; your job is to confirm they are configured for this AIC and visible to the right people.
| Surface | Used for | Cadence |
|---|---|---|
| AIC Studio → Run History | Single-run investigation, handled vs unhandled, token usage, timeline inspection | Daily + on incident |
| AIC Studio → Debugging Console | Live conversation trace, step-by-step reasoning, tool-call drilldown | On incident |
| Analytics → Bot Performance | Traffic volume, handled-message %, self-service ratio, top features / tool calls / policies | Daily + weekly |
| Analytics → Session / User Metrics | Active users, session counts, peak usage times, feedback (👍/👎) | Weekly |
| KM → Health Dashboard | Article staleness, parser success, sync status, Smart Testing accuracy | Weekly |
| Integrations → Execution Logs | Outbound API call status, latency, failure patterns, request/response payloads | Daily + on incident |
| Integrations → Critical Alerts | Rule-based alerts for failures, latency thresholds, credential expiry | Continuous (alert-led) |
| Audit Logs | Who changed what (AOP versions, Tool configs, audiences, KM sources) | Weekly + on incident |
Output of Step 1
A signed-off operations card for the AIC that lives with the runbook:
AIC name: Leave Buddy
L1 responder: IT Service Desk —#aic-leavebuddy-alertsSlack
L2 responder: HR Platform team —[email protected]
Business owner: HR Ops Director — owns the 70% deflection metric
SLOs: AOP completion ≥ 92%; tool call success ≥ 95%; p95 turn latency ≤ 6s; KM sync freshness ≤ 24h
Alert routing: P0 → PagerDuty; P1 → Slack + email; P2 → weekly digest
Review cadence: Daily smoke (09:30 IST); weekly ops review (Mondays); monthly business review (first Thursday)
If you cannot fill this card on day one, defer go-live — unowned AICs decay fast.
Step 2 — Monitor AIC run health via Run History and Debugging Console
Run History is the single most important production surface. Every turn of every conversation, every scheduled run, every AOP invocation lands here with full lineage. If L1 can fluently use Run History, 80% of production support is already covered.
What Run History captures
Every run record carries the full execution lineage — the channel and user who triggered it, the AOP and version that ran, the Tools invoked, the LLM reasoning, the tool call inputs/outputs, any human-in-the-loop approvals, any guardrail events, the tokens consumed, and the final status (handled, unhandled, escalated, failed).
What to watch daily
- Handled vs unhandled ratio. The headline number. A sudden drop in handled % is almost always either a broken integration, a KM sync failure, or an AOP change that rolled backwards. Investigate any 5+ percentage-point drop day-over-day.
- Run volume. Out of the ordinary volume spikes or dips often point at upstream issues — a channel degradation, an SSO outage, or conversely a company-wide email that routed traffic at the AIC.
- Top unhandled intents. The Debugging Console surfaces these. New categories of unhandled queries usually mean the world changed (a new policy, a new tool, a new edge case) — that is signal for the build team, not noise.
- Tool call failure rate by Tool. A specific Tool failing a lot narrows the blast radius — is it one integration, one payload shape, one audience? This is where you pivot to integration health (Step 4).
- Guardrail firing rate. Not zero — you want to see PII redaction and moderation firing regularly on real traffic. But a sharp increase in jailbreak detections is worth a look.
How to investigate a single failed run
The Debugging Console is built exactly for this. Pull up the run by request ID or by user, and walk the timeline in order:
- Trigger — channel, user, AOP version selected.
- Tool discovery — which Tools the orchestrator exposed to the AOP.
- LLM reasoning + tool calls — every step the AIC took, with inputs and outputs fully captured.
- KM retrievals — every article cited, with IDs and audience checks.
- Guardrail events — any PII detection, moderation, or jailbreak signal, with what was redacted or blocked.
- Human-in-the-loop events — any approval, any handoff.
- Outcome — handled / unhandled / escalated / failed, with the final message sent to the user.
A failed run almost always makes sense once you walk the timeline in order. Do not skip steps — the root cause is usually two or three steps upstream of the visible error.
Rule of thumb
If a run failed and you cannot reconstruct why from Run History in under five minutes, the issue is not the run — it is your monitoring setup. Feed that back as an improvement to this guide.
Step 3 — Monitor AOP executions, including Workbench-scheduled runs
AOP-level monitoring is where you spot which procedures are degrading before end users complain. User-initiated AOPs and Workbench-scheduled AOPs need slightly different treatment — Workbench runs have no end user on the other side, so failure is silent by default.
For user-initiated AOPs
Track these per AOP, per week:
- Completion rate — % of invocations that reach the intended conclusion. Separate natural completions from escalations / handoffs.
- Average steps per run — if this is creeping up, the AOP is getting more conversational; usually a sign the LLM is looping or the instructions have an ambiguity.
- Average and p95 latency — per AOP and per Tool within the AOP. Latency regressions are usually integration-side.
- Tool invocation pattern — which Tools are actually being called. If a Tool the AOP lists never fires, either the instructions never route to it or the orchestrator cannot pick it. Both are build-team signals.
- Confirmation / write-action outcomes — for any AOP that mutates a system of record, confirm the write succeeded downstream and the user received the confirmation message.
For Workbench-scheduled AOPs
These need their own weekly review because they have no user to complain when they break.
- On-time rate — did the run fire within the agreed tolerance of its scheduled time?
- Status distribution —
EXECUTEDvsFAILEDvs unexpectedCANCELLED. Cancellations often indicate lock contention, which is worth investigating even when the next run succeeds. - Next-occurrence integrity — for recurring schedules, every successful run should have a populated next-occurrence row. A missing next row means the scheduler stopped; nobody will notice until the missed slot.
- Downstream artifact count — if the AOP creates tickets / records / notifications, the count per run should be in an expected range. A sudden zero or a sudden 10x is the tell.
- Idempotency — if a run retried, confirm no duplicates downstream. This is the defect that hurts most in production because it only surfaces under failure conditions, which is exactly when you are not looking.
What to alert on
Workbench schedules are the clearest case for paged alerts — silence is failure. Wire alerts for:
- Scheduled run did not fire within X minutes of its slot.
- Scheduled run returned
FAILEDfor two consecutive occurrences. - Schedule was modified outside of a change window.
- The run's run-as identity lost its integration access (credentials expired, permissions revoked).
Output of Step 3
A per-AOP SLO tracker reviewed weekly:
| AOP | Type | Trigger | Completion rate (target) | p95 latency (target) | Last regression investigated |
|---|---|---|---|---|---|
| Apply for Leave | Primary | Manual | 94% (≥ 92%) | 5.4s (≤ 6s) | — |
| Check Leave Balance | Primary | Manual | 99% (≥ 95%) | 1.8s (≤ 3s) | — |
| Monthly Leave Balance Reminder | Primary | Workbench (monthly) | 100% of 3/3 runs | N/A (async) | — |
| Escalation Sweep | Primary | Workbench (nightly) | 100% of 30/30 runs | N/A (async) | W42: lock contention → fixed |
| Notify Manager & Wait for Approval | Helper | Parent-invoked | 97% of parent successes | — | — |
Step 4 — Monitor Tools (BotTasks) and integration health
An AIC is only as reliable as the systems it talks to. Integration monitoring is the single biggest predictor of whether an AIC will have a good week or a bad one — and it is what drifts most silently. Credentials rotate. APIs get deprecated. Sandbox tenants get refreshed. Connector versions change under you.
What to watch continuously
- Connection status per integration. Each integration has a live connectivity state. If it flips to failed, the AOPs that depend on it are one turn away from a P1 incident.
- Credential expiry horizon. OAuth tokens, cert-based auth expiries, service-account password rotations. The Credential Monitor surfaces these; wire an alert for anything expiring in the next 30 days.
- Integration Execution Logs. Every outbound call the AIC makes is captured with status, latency, and payload. Watch for:
- A rising 4xx rate on a specific endpoint (schema change, auth drift, entitlement change).
- A rising 5xx rate (third-party is struggling; this is information your IT team wants).
- Rising p95 latency (degrades AIC responsiveness well before it shows up in AIC dashboards).
- A sudden zero-call count on an endpoint that used to be busy (orchestrator stopped picking that Tool — probably an AOP change).
- Critical Alerts rule engine. This is the native alerting for integration failures, latency thresholds, and credential expiry. Configure rules per integration — do not leave them on defaults. Thresholds should match the AIC's SLO, not the connector's tolerance.
For MCP-backed Tools
MCP servers have their own health model — server reachability, tool-discovery consistency, and per-tool success rate. Additionally:
- Confirm the expected tool surface is still present. If the MCP server upstream removed or renamed tools, the AOP using them will start failing tool selection silently.
- Watch for tool-selection churn. If the LLM is picking different tools for the same intent run-over-run, the tool descriptions may have drifted.
For Workflow-backed Tools
Workflows have their own execution logs in Workflows Studio, in addition to the Integration Execution Logs for any outbound calls inside the Workflow. Cross-reference the two when debugging:
- A Workflow that completes
successfulbut whose outbound API call returned 4xx is a silent-failure bug — the Workflow's error handling swallowed the error and the AIC told the user the action was done. - A Workflow that fails immediately at its first step almost always indicates a missing or malformed input from the AIC. Check the AOP's payload against the Workflow's input schema.
For KM Tools
Treated more in Step 5, but note here: KM retrieval is a Tool category. Its failures look different — not 4xx/5xx, but empty-retrieval or wrong-audience results.
Output of Step 4
An integration health matrix reviewed weekly:
| Integration | Status | Credential expiry | 7-day error rate | p95 latency | Owner | Notes |
|---|---|---|---|---|---|---|
| Workday (RaaS + REST) | ✅ | 92 days | 0.4% | 1.2s | HR Tech | — |
| ServiceNow (OAuth) | ✅ | 21 days | 1.1% | 680ms | IT Ops | Rotate in next window |
| SharePoint (cert-auth) | ✅ | 145 days | 0.1% | 410ms | IT Ops | — |
| Custom payroll API | ⚠️ | 7 days | 3.2% | 2.8s | Finance IT | Schema change suspected |
Step 5 — Monitor Knowledge Management retrieval quality
Many AIC incidents are mis-diagnosed as AOP bugs when the real cause is KM. An article got unpublished, a connector sync silently failed, an audience was re-scoped, a policy was updated in Word but never made it to SharePoint. The AIC will confidently return stale, partial, or wrong answers — and unless you are watching KM, the first signal will be an unhappy user three weeks later.
What to watch weekly
- Sync status per KM source. Every source has a last-sync timestamp and outcome. Anything that has not run cleanly in 48+ hours is worth investigating; anything red for 72+ hours is an incident.
- Article-count trends. A sudden drop in article count after a sync is the classic "someone cleaned up the SharePoint site" signal. Reconcile with the source-of-truth owner before it reaches a user.
- Parser success rate. Articles that synced but failed to parse are effectively invisible to retrieval. The KM Health Dashboard surfaces these — route them back to the content owner to fix format.
- Article staleness. Articles whose last-updated date is older than the source's update cadence. For policies that review quarterly, anything older than a year is suspect.
- Smart Testing accuracy scores. KM ships scripted retrieval tests that grade whether the right article comes back for a representative query set. Treat the accuracy trend as a leading indicator — it drifts down before end-user complaints start.
Per-run grounding checks
In Run History, every retrieval-based turn captures which articles were retrieved and which were cited. Spot-check this weekly on a sample of real runs:
- Is the cited article actually the right one for the question?
- Did the response draw only from the cited article, or did it go beyond it (hallucination signal)?
- For segment-restricted queries, did the persona get the article appropriate for their segment — not the generic one?
Audience drift
This is the subtle one. Articles carry audience metadata inherited from the source's permissions. When someone edits permissions on the SharePoint site or the Confluence space, audience derivations change on the next sync. A previously-scoped article can suddenly become visible to everyone, or vice versa. Two signals:
- An audit-log entry for audience change on a KM article with no corresponding business change request.
- A spike in retrievals of an article from users outside its intended audience.
Output of Step 5
A KM health summary reviewed weekly:
| KM source | Sync freshness | Parser success | Article count trend | Smart Testing accuracy | Owner for freshness | Action items |
|---|---|---|---|---|---|---|
| Global HR Policies | 2h | 99.6% | 251 (stable) | 94% | HR Ops | — |
| IT Knowledge Base | 4h | 98.1% | 1,418 (+6) | 91% | IT Ops | Review 3 parse-fails |
| Country holiday calendars | 7d (annual) | 100% | 38 (stable) | — | HR Shared Services | Refresh due in Q1 |
| FAQs (Confluence) | 1h | 99.8% | 88 (+2) | 96% | HR Ops | — |
Step 6 — Monitor guardrails and governance
Guardrails in production have two failure modes and you monitor for both. They can fail closed — blocking or redacting legitimate traffic, frustrating users. They can fail open — letting sensitive content, abuse, or jailbreak attempts through. Both are serious; the first erodes usability, the second erodes trust and can trigger a compliance incident.
What to watch weekly
- Guardrail event volume, by type. PII detection, toxicity / moderation, jailbreak detection — each should fire at a non-zero, stable rate on real traffic. A sudden drop in firings usually means the guardrail silently disabled; a sudden spike usually means new traffic patterns (often legitimate) hitting old thresholds.
- False positive rate. A sample of fired guardrails reviewed by a human — were they genuinely offensive / risky, or benign? Thresholds that served well in UAT often need tightening or loosening once real language enters the system.
- Unredacted PII in transcripts. Spot-check Run History transcripts for patterns the redactor should have caught (emails, phone numbers, IDs). The redactor persists entity counts and placeholder mappings per turn, so this is auditable.
- Audit log integrity. Every change to an AOP, Tool, audience, KM source, or guardrail configuration should appear in the Audit Log with actor, timestamp, and diff. A week with zero audit events on a living AIC means capture is broken, not that nothing changed.
- Role / audience access review. Quarterly: re-confirm who can reach each AIC, each AOP, each KM source. Especially after org changes, M&A, or reorgs, audience-gated content is the easiest thing to leak.
Alerting
- Paged alert if the PII detector appears to have failed open on a high-traffic AOP (e.g., zero PII events over a window where multiple are expected).
- Paged alert if jailbreak detection rate spikes dramatically — either an adversary is probing, or a threshold regressed.
- Email digest of all configuration changes (AOP version activations, Tool edits, audience modifications, guardrail threshold changes) — reviewed weekly by the business owner.
Rule of thumb
Every guardrail event in production is either a signal (real abuse caught, real PII redacted) or a defect (false positive). Neither should be ignored. If your team does not triage guardrails weekly, they are decorative.
Step 7 — Monitor cost, performance, and capacity
The CIO bought an AIC to deflect tickets, not to blow up the LLM bill. Cost transparency is how you prove the AIC is actually paying for itself — and catch runaway behaviours (infinite loops, misrouted traffic, cost-heavy AOPs) before they become a finance conversation.
Token attribution
Every AIC execution carries token accounting — input tokens, output tokens, total tokens — attributed to the specific AOP, the specific steps, and through to the Tool calls. Run Insights surfaces this per-run and aggregated.
What to watch monthly:
- Token spend per AIC, per AOP. Is the distribution what you expect? If one AOP is disproportionately expensive, either it has more steps than it should (prompt engineering opportunity) or it is being invoked more than expected (pleasant surprise or misrouting).
- Token spend per run. The median should be stable. A creeping tail of very high-token runs is usually a looping AOP or an AOP that is re-asking the user for information it already has.
- Cost per successful outcome. The business metric. Tokens per handled ticket, tokens per scheduled run. This is the number the business owner cares about.
- LLM model mix. If the platform supports multiple models, confirm the routing still matches the original cost/quality tradeoff. Models get promoted and deprecated; assumptions from six months ago may no longer hold.
Latency
- p50, p95, p99 turn latency by channel and by AOP. Voice is much stricter than chat; set SLOs accordingly.
- Latency decomposition. User-message-to-LLM, LLM-to-tool-call, tool-call-to-response, response-to-user. Instrumented via OTel. When latency regresses, the breakdown tells you whether the fault is model, tool, or transport.
- Scheduled AOP execution duration. Track per-Workbench. An AOP that took 2 minutes last month and 6 minutes this month is drifting — usually because the dataset it iterates over is growing.
Capacity
- Concurrent active runs. Peak observed vs tenant capacity. Plan capacity increases before you hit the ceiling, not after.
- Traffic growth trend. If adoption is succeeding, traffic compounds. Make sure integration rate limits (Workday, ServiceNow, SharePoint) scale ahead of it.
- Workbench scheduling density. Too many schedules clustered at the top of the hour causes contention. Stagger high-volume scheduled AOPs.
Output of Step 7
A monthly cost and performance review shared with the sponsor:
| Metric | Month | Target | Trend | Action |
|---|---|---|---|---|
| Total runs | 184,302 | — | ↑ 12% | — |
| Handled % | 93.4% | ≥ 92% | ↔ | — |
| Cost per handled run | $0.042 | ≤ $0.05 | ↓ 8% | — |
| p95 turn latency | 5.1s | ≤ 6s | ↔ | — |
| Top AOP by token share | Apply Leave (34%) | — | ↑ | Review prompt — 2 redundant steps |
| Workbench on-time rate | 99.7% | ≥ 99% | ↔ | — |
| Credential expiries next 30d | 2 | — | — | Rotate ServiceNow OAuth |
Step 8 — Incident response and continuous improvement
Monitoring is not an end in itself. It exists to shorten the distance between "something is wrong" and "something is fixed," and to feed what you learn back into the AIC.
Incident response
Agree these before you need them — not during the incident.
- Severity definitions (reuse from UAT): P0 halts the AIC, P1 must be fixed same day, P2 enters the backlog, P3 is log-only.
- Kill switches — documented and tested: pause a Workbench, disable an AOP, revert an AOP to a previous active version, disable a specific Tool, put the AIC into maintenance on a channel.
- Runbook per high-impact AOP — symptoms, diagnostic steps, rollback procedure, owner to call. Stored with the AIC, not on someone's laptop.
- Post-incident review. For any P0 or P1, a written RCA within five business days — what happened, why, how it was detected, how it was fixed, what prevents it recurring. Feed the "what prevents it" into the dashboards and alerts from Steps 1–7.
Continuous improvement
Each review cadence produces inputs:
- Daily smoke → intraday fixes. Anything broken right now.
- Weekly operational review → sprint items. AOP tuning, KM content gaps, threshold adjustments, small integration fixes.
- Monthly business review → roadmap items. New use cases, new AOPs, new integrations, AICs for adjacent functions.
- Quarterly governance review → policy items. RBAC, audience re-scoping, guardrail threshold recalibration, model-mix reviews.
Feedback loops to capture
- User feedback (👍/👎) on AIC responses, surfaced in session metrics. A response the AIC considered handled but the user marked 👎 is the most direct training signal you have.
- Helpdesk Insights clustering of tickets that still reach the human queue — topics the AIC is not handling that maybe it should.
- Unhandled intent clusters from Bot Performance — the next AOP or the next KM article is usually here.
- UAT-accepted P2 backlog — defects that were tolerated at go-live; revisit monthly.
Production monitoring checklist
Within two weeks of go-live, confirm all of this is in place:
- Step 1: Operations card signed off — named L1, L2, business owner, SLOs, alert routing, review cadence
- Step 2: Daily Run History review is actually happening — L1 can open a run and walk the timeline fluently
- Step 3: Per-AOP SLO tracker populated; Workbench-run alerts wired for missed / failed scheduled occurrences
- Step 4: Integration health matrix populated; Critical Alerts rules configured per integration; Credential Monitor alerts for next-30-day expiry
- Step 5: KM Health Dashboard under weekly review; Smart Testing scripts running; audience-drift audit in place
- Step 6: Guardrail event volumes baselined; false-positive sampling cadence agreed; audit log integrity verified
- Step 7: Token attribution and cost-per-outcome metrics reported monthly to the business owner
- Step 8: Runbooks written per high-impact AOP; kill switches tested; RCA template adopted
If any box is unchecked after week two, that dimension is an active risk — flag it in the monthly business review.
Common pitfalls to avoid
A few patterns that come up repeatedly in production:
- Monitoring configured but no one reviews it. The most common failure mode. Dashboards exist, alerts route into a channel nobody reads, and the first signal of degradation is an angry email from a VP. Fix by assigning a named daily smoke owner with a 10-minute checklist — not a team.
- Alert noise fatigue. Alerts on every minor blip train responders to ignore them. Tune thresholds to the SLO, not to the connector default. If an alert has fired 20 times this month and no one acted on it, it is not an alert — delete it or re-scope it.
- Treating KM as set-and-forget. Content owners move on, sources get re-orged, articles go stale. Every KM source needs a named freshness owner and a refresh cadence, or quality decays invisibly.
- Integration changes made without telling the AIC team. An IT team rotates a service account, deprecates an API, or refreshes a sandbox, and the AIC breaks at 9am the next day. Put the AIC on the same change-management list as the systems it integrates with.
- Workbench drift. Schedules get added ad-hoc, clustered at the same time, running as the wrong identity. Review the full Workbench catalog quarterly.
- Silent AOP regressions from version promotion. A draft AOP is promoted to active, something subtle breaks, and nobody notices because no one is monitoring the handled % of that specific AOP. Every AOP version promotion is a change event — confirm the first 24h of post-promotion metrics match the last 24h pre-promotion.
- Guardrails turned off because "false positives are annoying." A guardrail that is too aggressive is a tuning problem, not a reason to disable. Disabled guardrails are the single fastest path to a compliance incident.
- Cost surprises. Token spend reviewed monthly only. By the time the invoice lands, the runaway AOP has been looping for three weeks. Cost should be a weekly glance, not a monthly shock.
- "The build team will fix it." Production operations ownership was never actually transferred. Build team is now also on-call forever, and nothing improves because they have no time to improve it. Enforce the hand-off: L1 must own daily ops within 30 days of go-live.
- No second AIC learnings. Each new AIC repeats the same setup mistakes the first one made. Keep a living "lessons learned" doc inside the CoE and require new AIC builds to read it.
What to do when something is on fire
Rapid triage when the AIC is misbehaving and you do not yet know why:
- Open Run History, filter to the last 60 minutes, check handled %. If it has collapsed, the scope is platform-wide.
- Check integration connection status. Any red connection explains a lot.
- Check KM sync status. Any red or unusually-old source explains retrieval-quality complaints.
- Check the latest audit log events. Somebody may have shipped an AOP change in the last hour; revert first, diagnose second.
- Check guardrail event rates. A guardrail failing closed can look exactly like a broken AOP.
- Pick one failing run and walk the Debugging Console timeline end-to-end. The actual root cause reveals itself within the timeline 90% of the time.
- If scope is platform-wide and no individual AIC cause is visible, escalate to the platform team — it may be an upstream Anthropic / LLM-provider / infra issue.
Revert first, diagnose second. A broken AIC degrades trust faster than a temporarily-simpler AIC ever will.
Next steps after you have this running
Once all three review cadences are happening reliably and the ops card is accurate:
- Publish monthly business-review decks to the sponsor — the AIC is a product, treat it like one.
- Use what you learned to improve the build guides — if every new AIC breaks the same way at week two, fix it in requirement gathering.
- Start measuring net deflection against the original success metric. Traffic volume is an input; deflection is the outcome.
- Consider whether a second AIC in the same function is warranted — the scope card and Step 1 from the Requirement Gathering guide are your starting point.
- Graduate high-confidence AOPs from confirmation-required writes to direct writes where the audit trail and rollback story support it — reduces friction, increases adoption.
- Share the operational runbook with IT Ops teams supporting sibling AICs. Cross-training reduces bus-factor risk across the CoE.
For the build-time counterparts to this guide, see Requirement Gathering and Planning UAT Testing on docs.leena.ai.
Updated about 1 month ago