
Evals
Evals lets AOP authors validate AOP behaviour before deployment. The system generates test cases from the AOP's own configuration, replays them under evaluation, and scores each run against a fixed set of LLM-judged metrics — so you catch failures, regressions, and compliance gaps before any user is impacted.
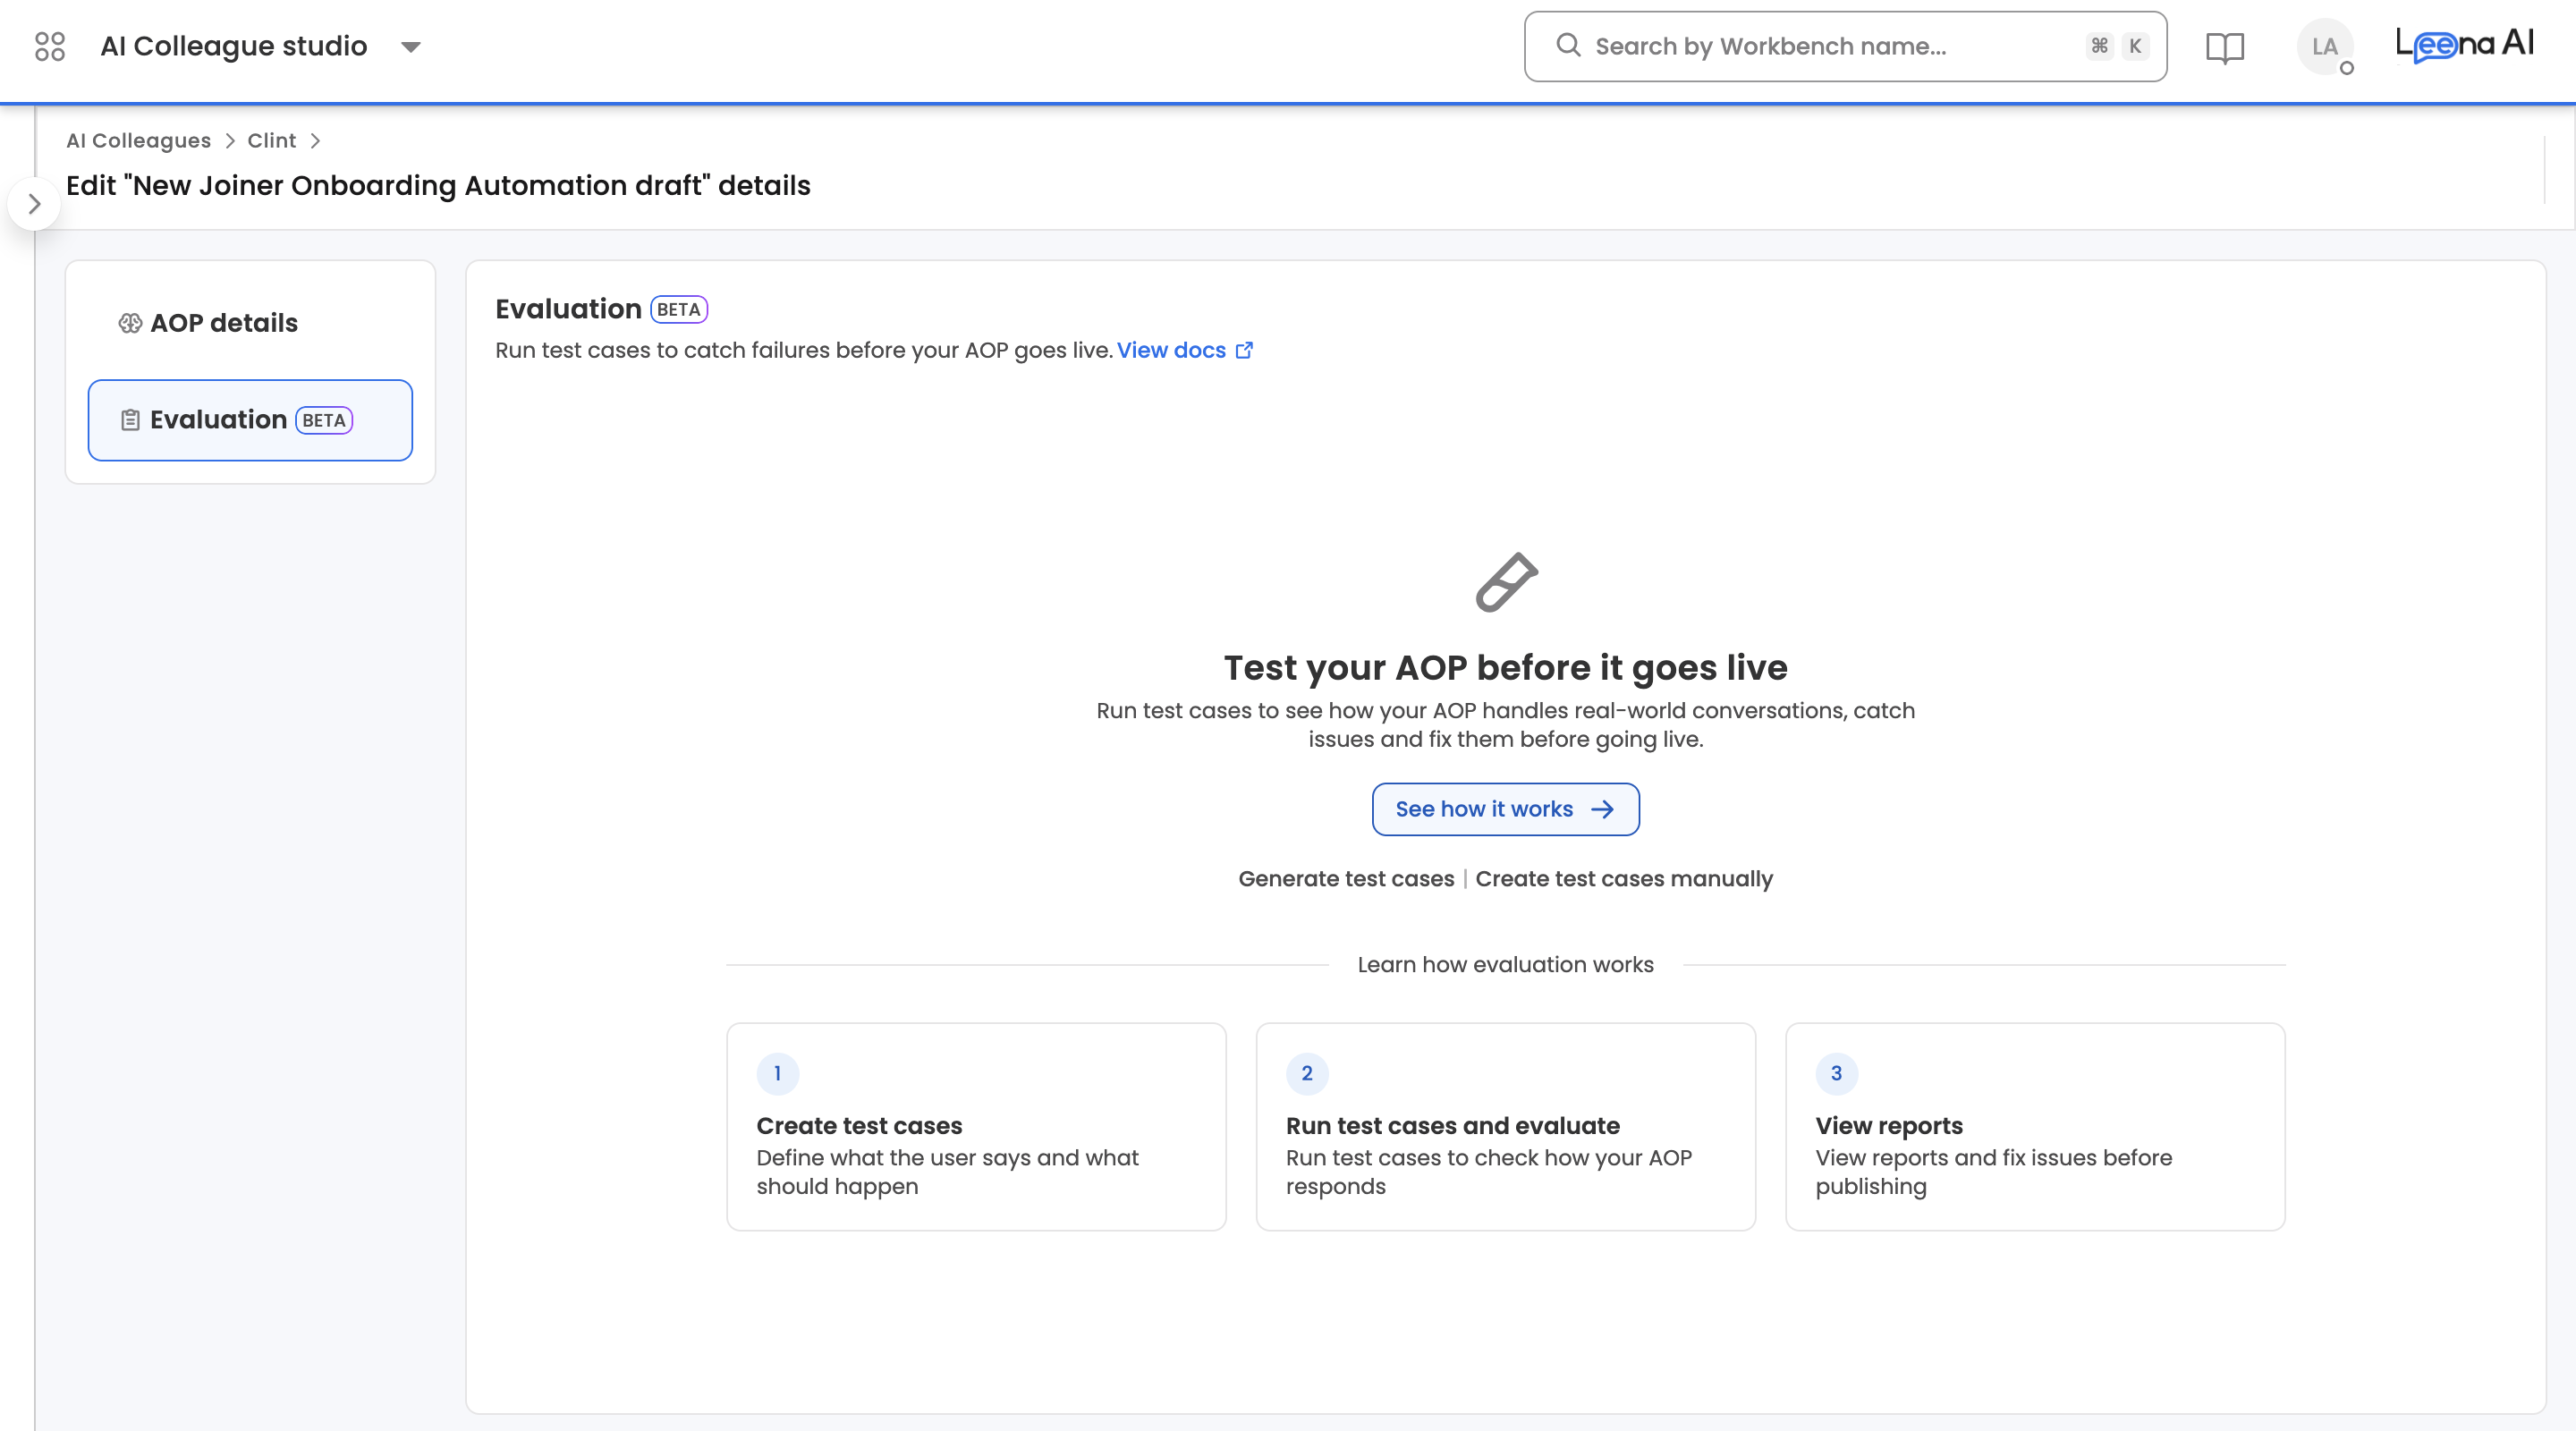
Navigate to AI Colleagues → [Select AIC] → [Select AOP] → Evaluation (BETA) to access this page.
Overview
The Evaluation (BETA) tab is organised into two sub-tabs:
| Sub-tab | What it contains |
|---|---|
| Test cases | The list of test cases for the AOP |
| Report | History of evaluation runs with per-run results, per-test-case aggregates, and per-execution detail |
Eval metrics are managed at the AOP level and applied automatically to every run.
Test cases
Watch the tutorial
A test case is a self-contained test of the AOP. It captures the user's initiation message, the expected flow of the conversation, any attachments the user would send, and a saved reference trajectory that every future evaluation run is compared against.
Test case IDs are allocated per AOP in the format SCN_000001, SCN_000002, and so on.
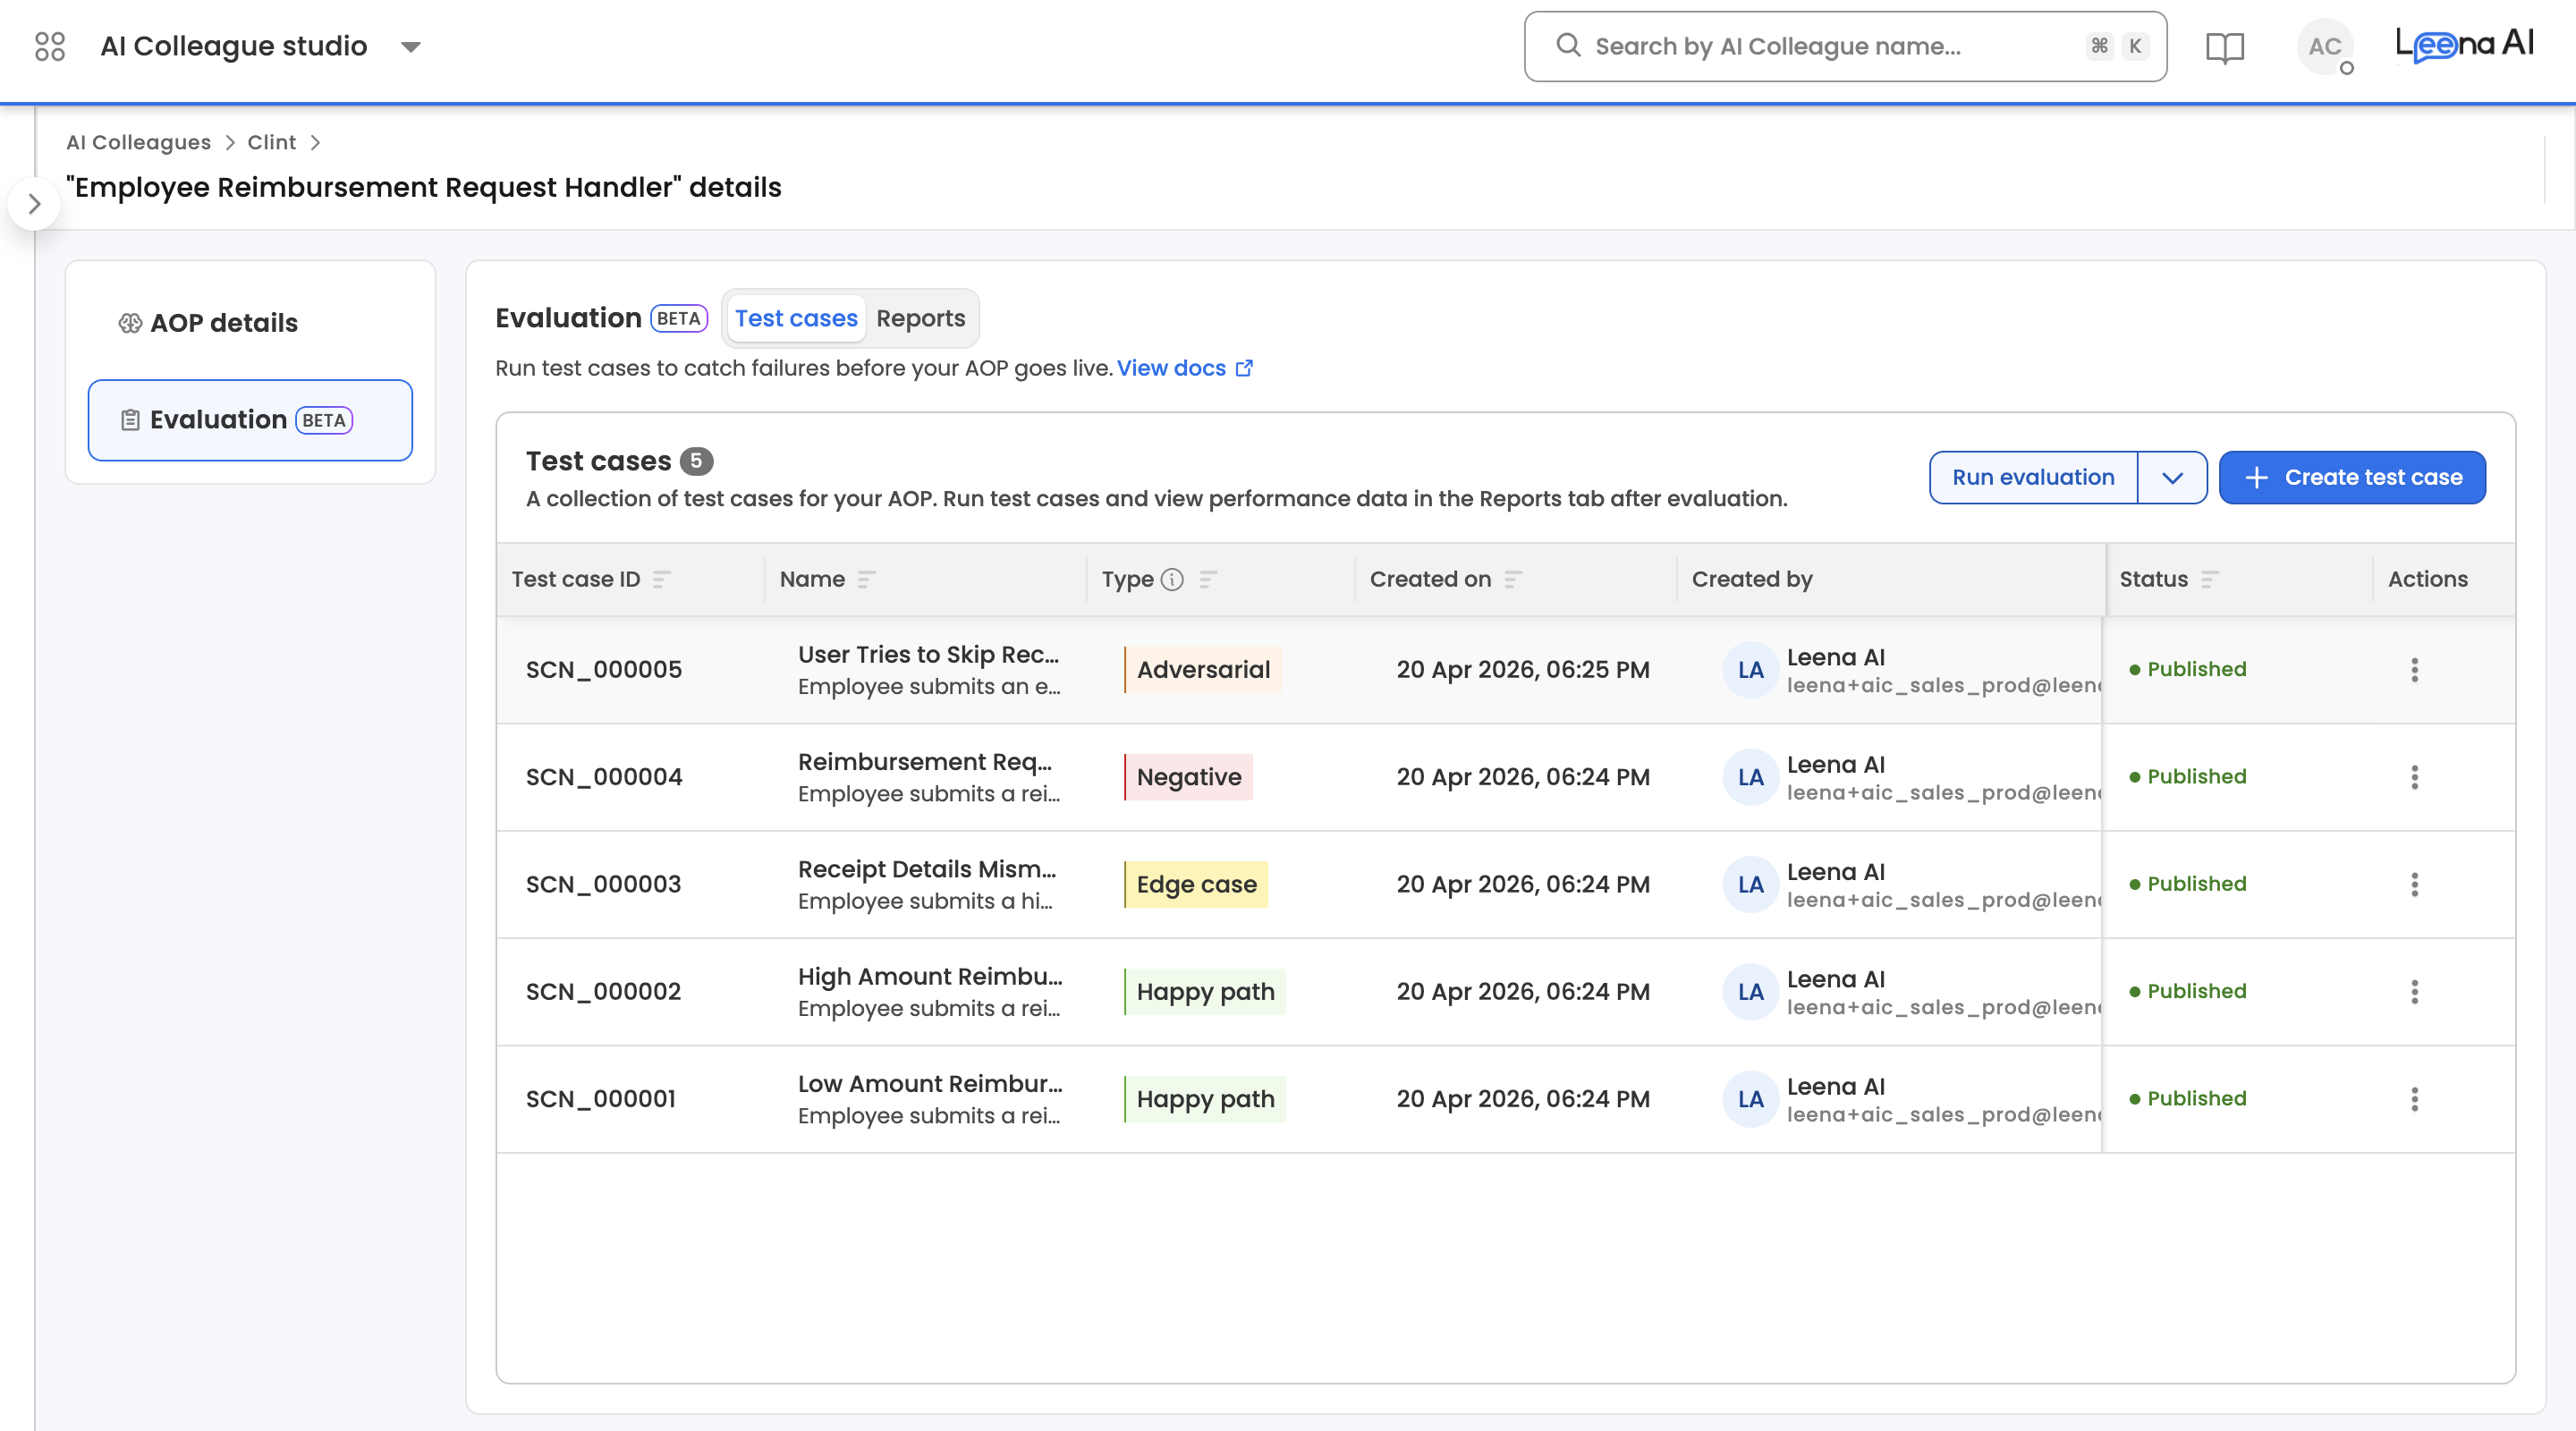
Test case list view
| Column | Description |
|---|---|
| Test Case ID | Human-readable identifier (e.g., SCN_000005) |
| Name | Test case name |
| Type | Test case type badge |
| Created By | Dashboard user who created the test case |
| Created On | Date and Time the test case was created |
| Status | Current lifecycle status |
| Actions | Per-row actions menu |
Clicking any row opens the test case in its detail view, where editing happens. The list supports sorting by Test Case ID, Name, Type, or Status.
Test case types
| Type | Purpose |
|---|---|
| Happy path | Tests the ideal, end-to-end flow with valid inputs and expected conditions. The baseline case that should always succeed. |
| Edge case | Probes boundary conditions, unusual values, or rare-but-valid inputs. Reveals how the system handles the extremes of its expected range. |
| Negative | Intentionally omits required information or sends malformed input. Verifies that the system rejects invalid requests with the right error. |
| Adversarial | Attempts to override instructions, inject false context, or exploit the model's behavior. Tests robustness against prompt manipulation. |
Test case status lifecycle
| Status | When it applies |
|---|---|
| In Progress | The generator is producing the test case and deriving its reference trajectory |
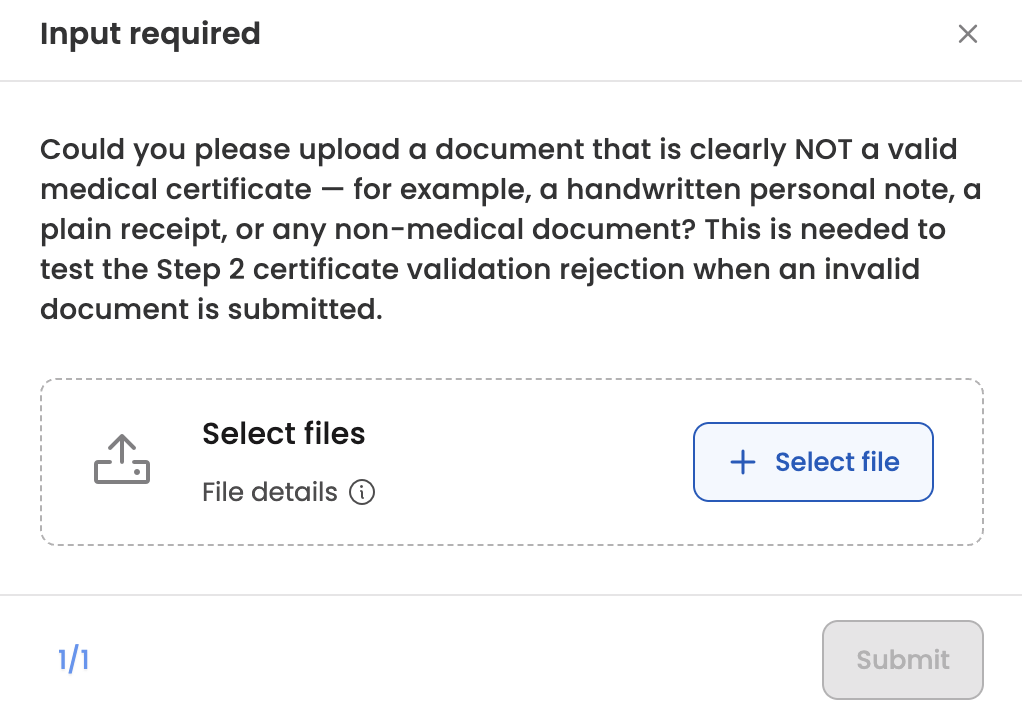
| Needs Input | The generator has requested additional reference documents before it can complete the trajectory. Open the test case to see what's being asked and upload the files. |
| Published | Trajectory generation succeeded. The test case is eligible for evaluation runs. |
| Failed | Trajectory generation failed. |
On successful trajectory generation, test cases move directly from In Progress to Published.
NoteA test case that is part of a live evaluation run is locked. It cannot be edited or deleted until that run completes.
Creating test cases
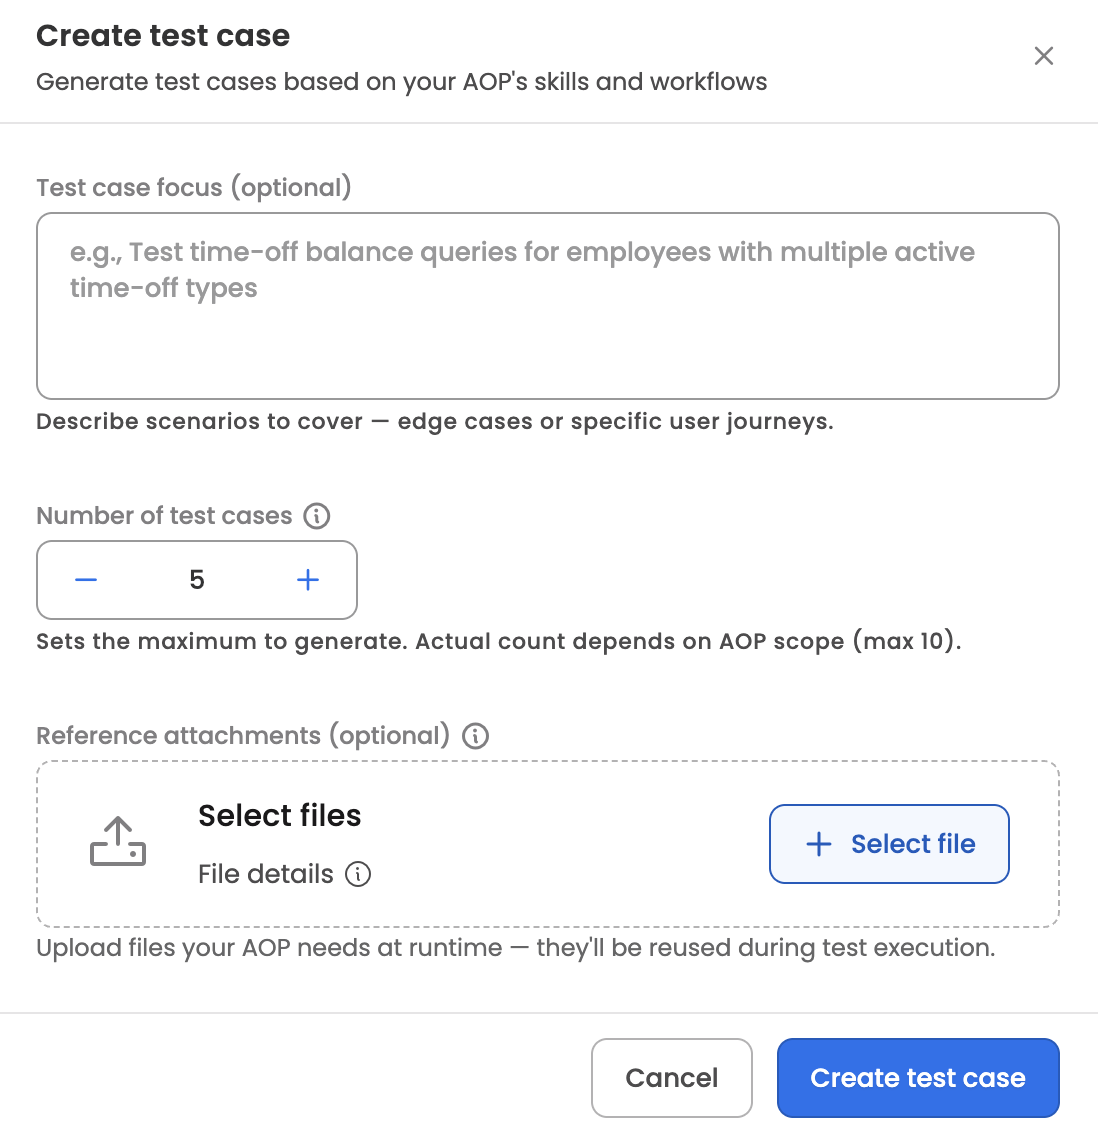
Click + Create test case to open the generator. Provide:
- Additional instructions — optional free-text guidance for the generator, up to 5,000 characters (for example, "focus on reimbursement claims above $1,000" or "include cases where receipts are missing").
- Number of test cases — between 1 and 10 per generation request.
- Reference attachments — optional files for the generator to read as context (e.g., policy documents, sample receipts).
The system runs an agent that reads the AOP's prompt, its linked skills, and existing test cases (to avoid duplicates), then produces the requested number of test cases. Each generated test case includes a name, description, type, initiation message, expected flow, and any attachments it needs.
While test cases are being generated, the Test cases tab shows a progress banner with a completed/total count. Generation typically takes 5–10 minutes. You can leave the page and come back — progress is preserved.
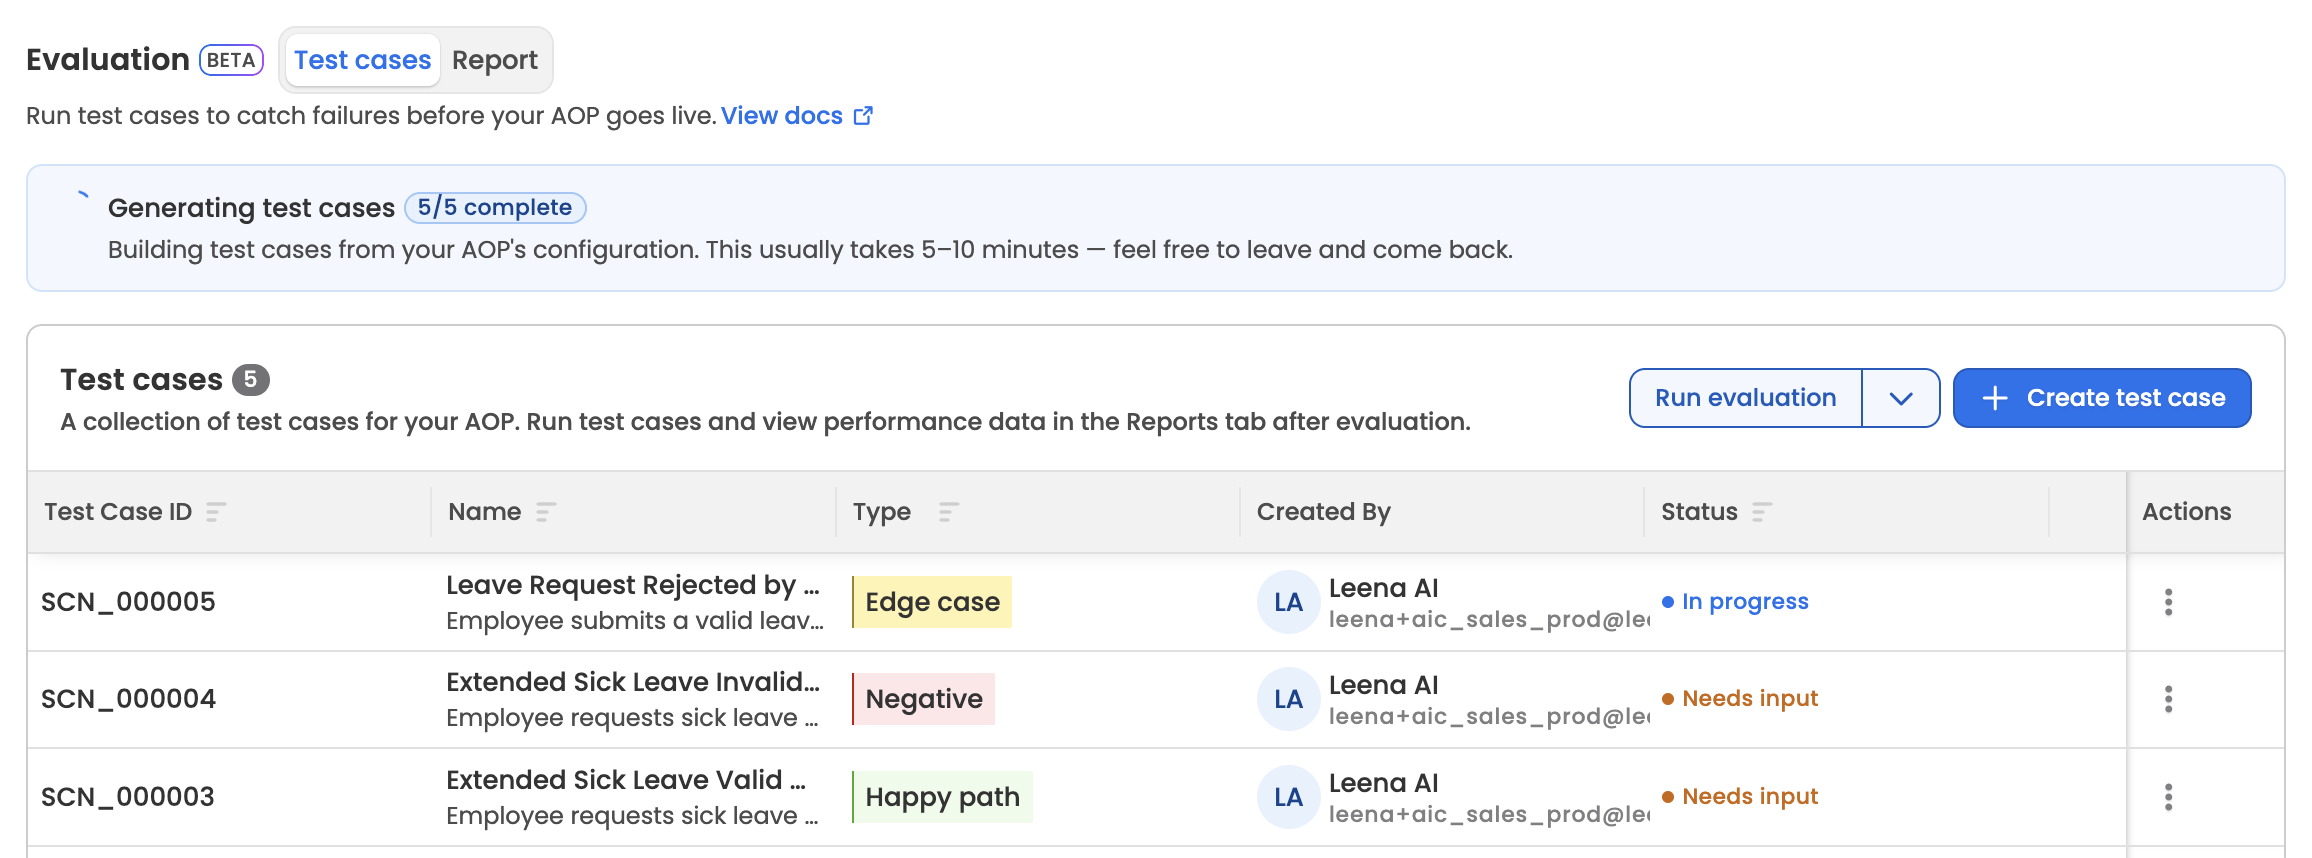
If the generator determines that a test case requires documents the user hasn't provided, that test case moves to Needs Input. Opening the test case shows the list of requested documents with an explanation of what each one is for. Uploading the requested files moves the test case back into In Progress and resumes trajectory generation.
Test case detail view
Opening a test case exposes its full specification.
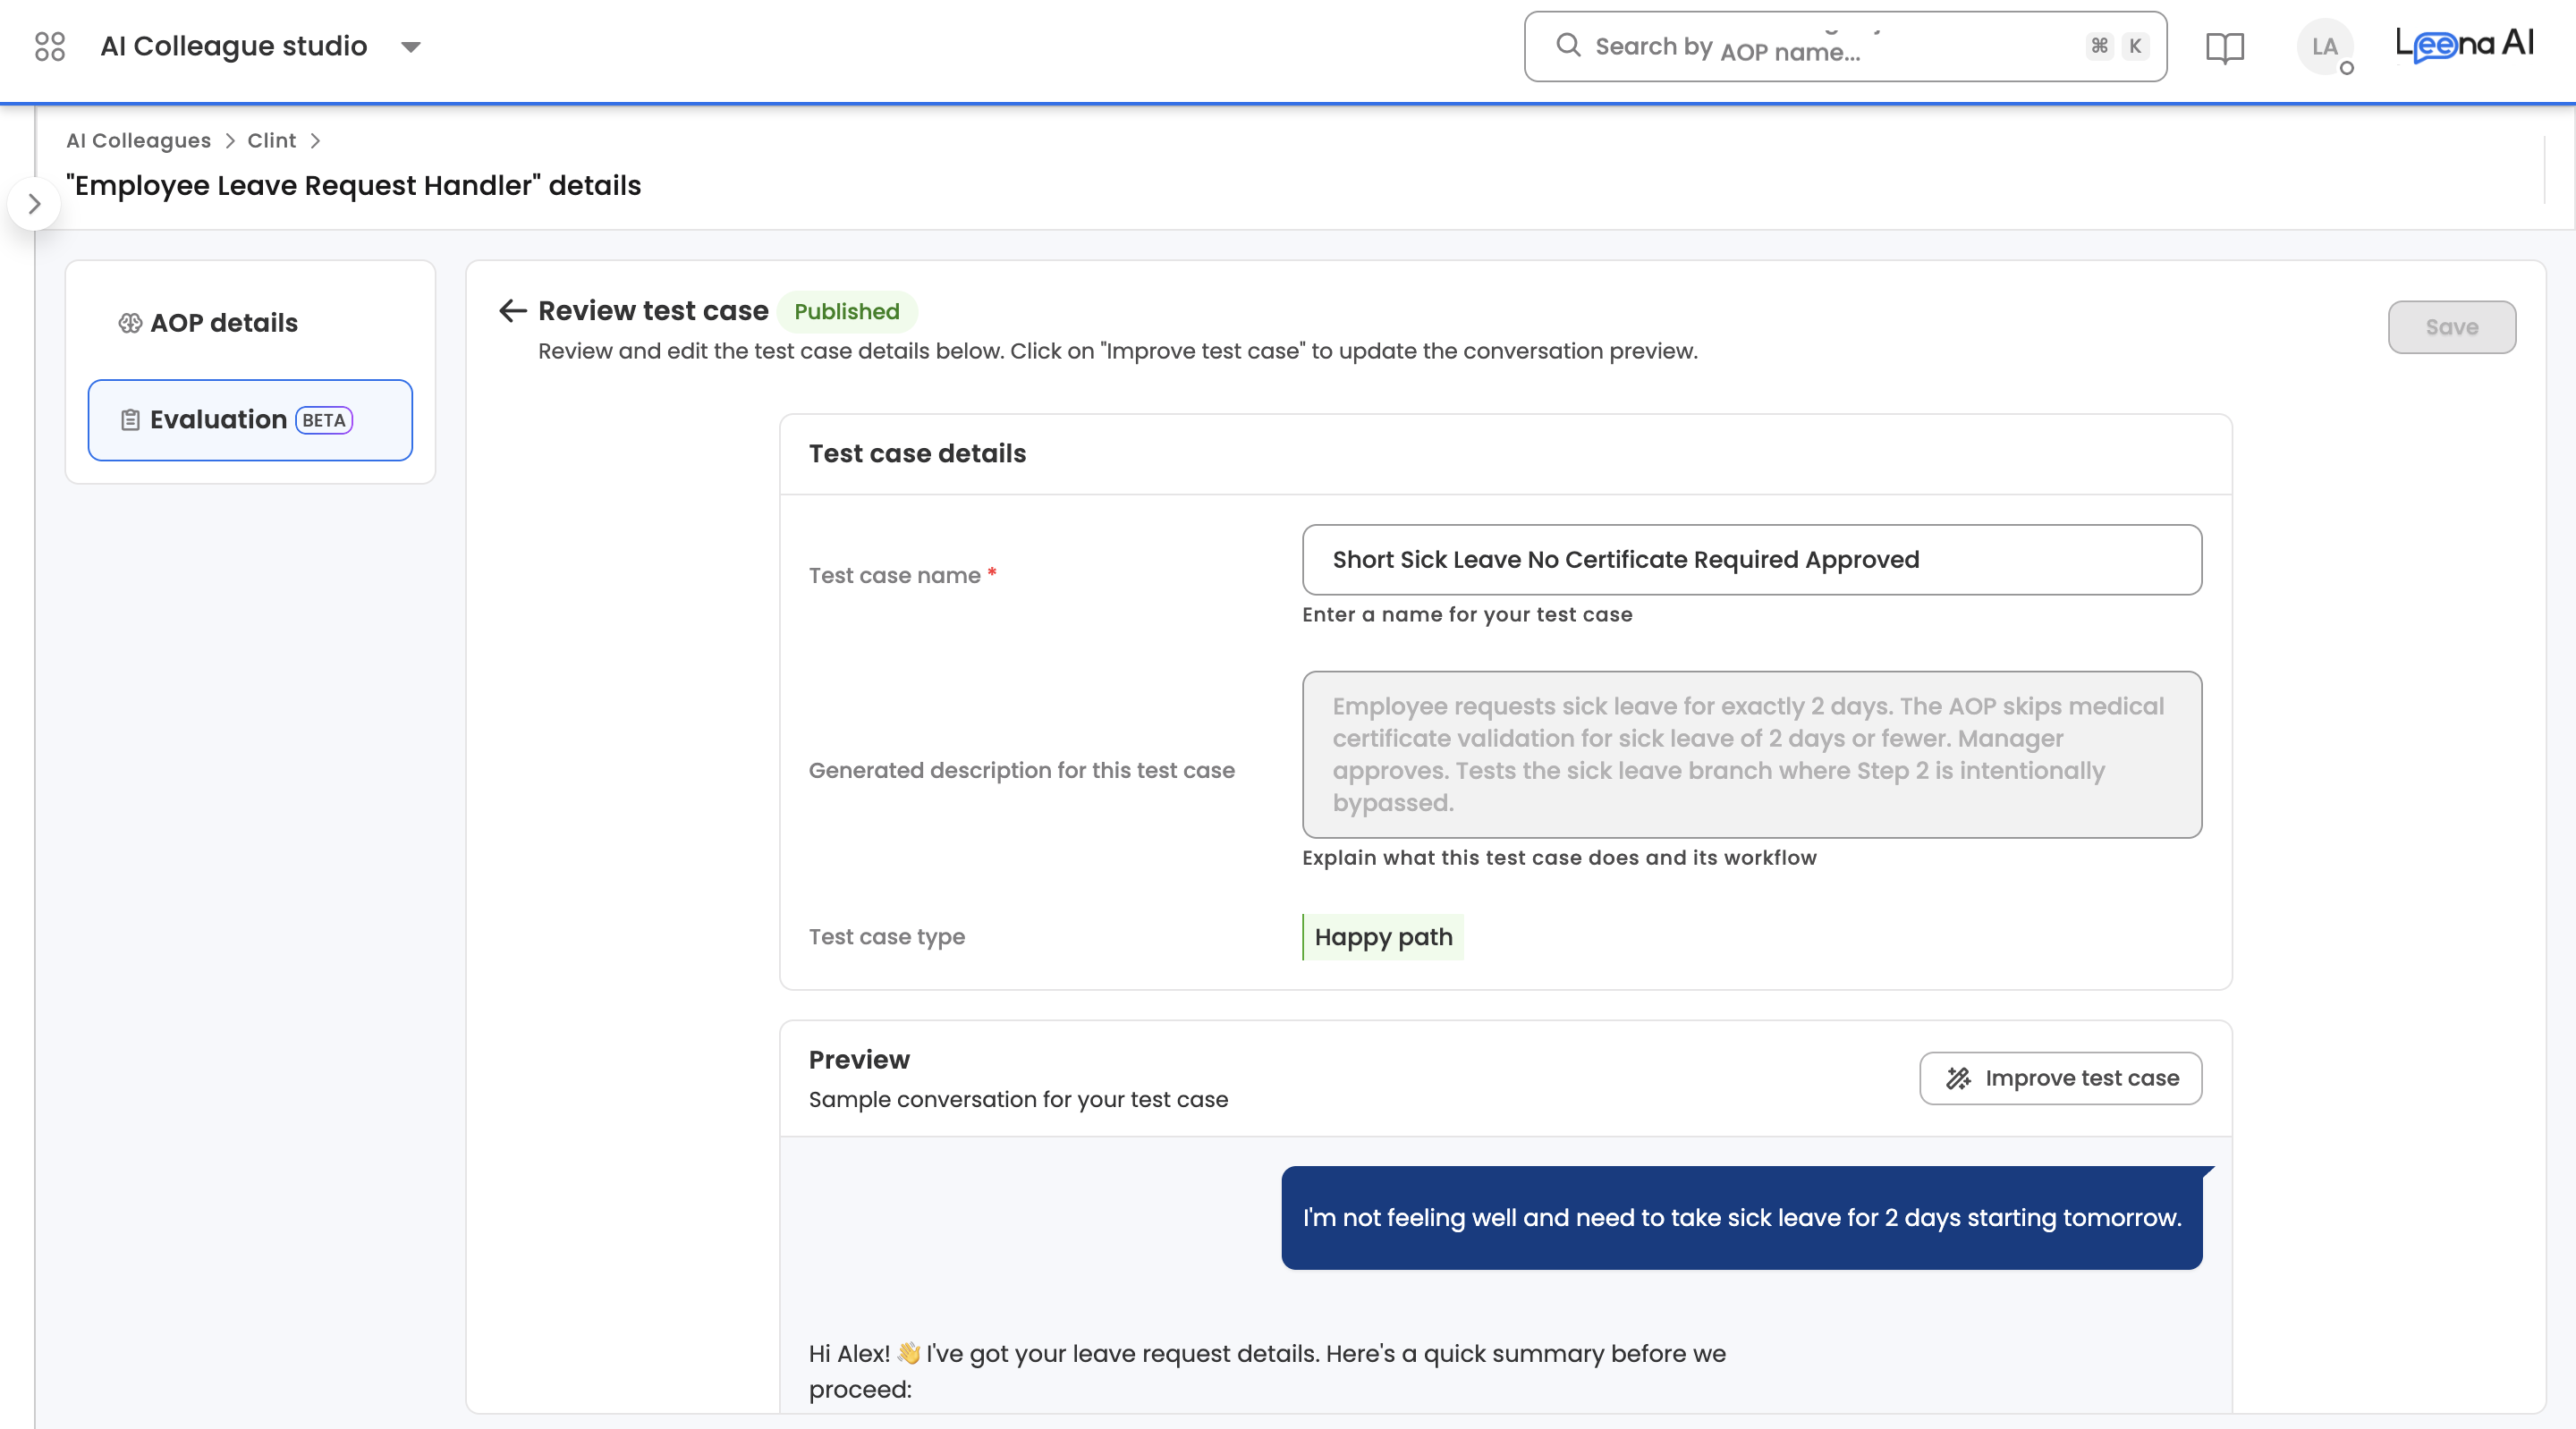
- Metadata — name, description, and type. Only the name can be edited directly from this view; description and type are shown for reference. To change the initiation message, expected flow, or any other generated aspect of the test case, use Improve test case (below).
- Trajectory — the full step-by-step conversation, including user messages, agent messages, and every tool call the agent made. This is what future runs are compared against.
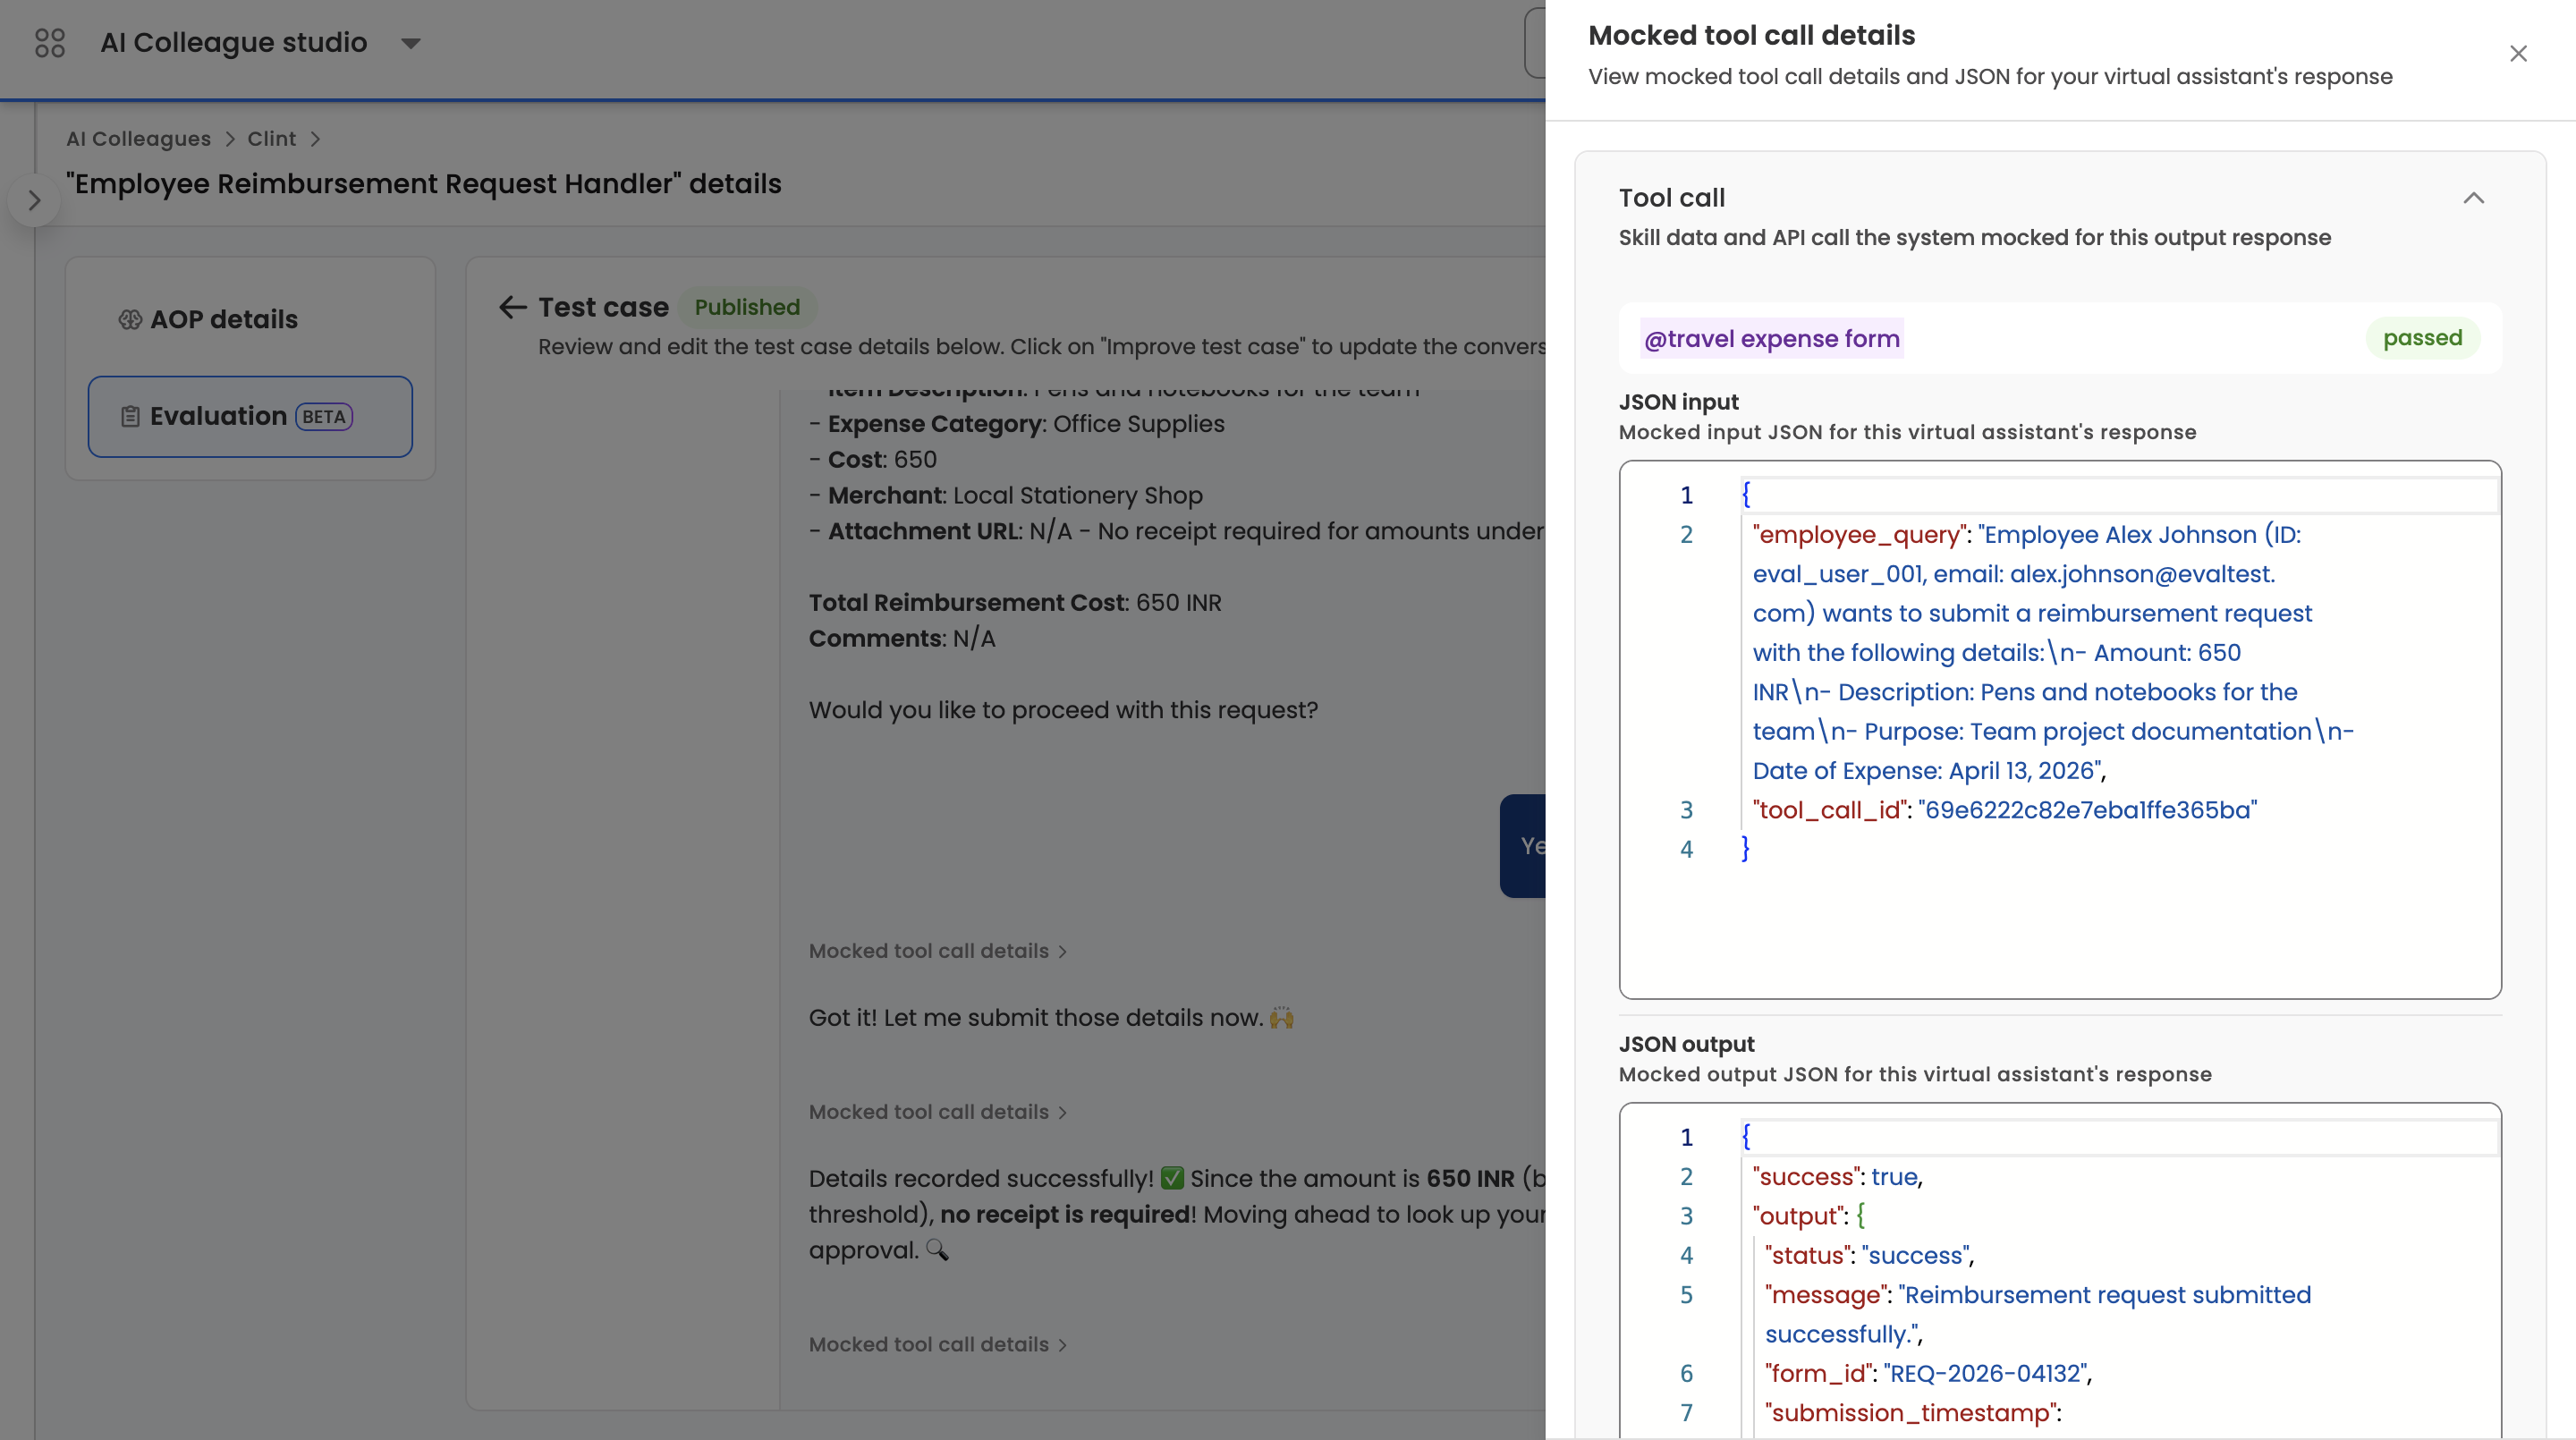
- Mocked tool call details — each tool call in the trajectory can be opened in a side sheet showing the tool name, status, the JSON input the agent sent, and the JSON output the tool would return. The JSON Output is editable — this is how authors set the data a tool returns in production (policy records, HR lookups, ticket data) so the AOP can be tested deterministically. The tool name, status, and JSON input are shown read-only as context. Large outputs are stored out-of-band and referenced automatically.
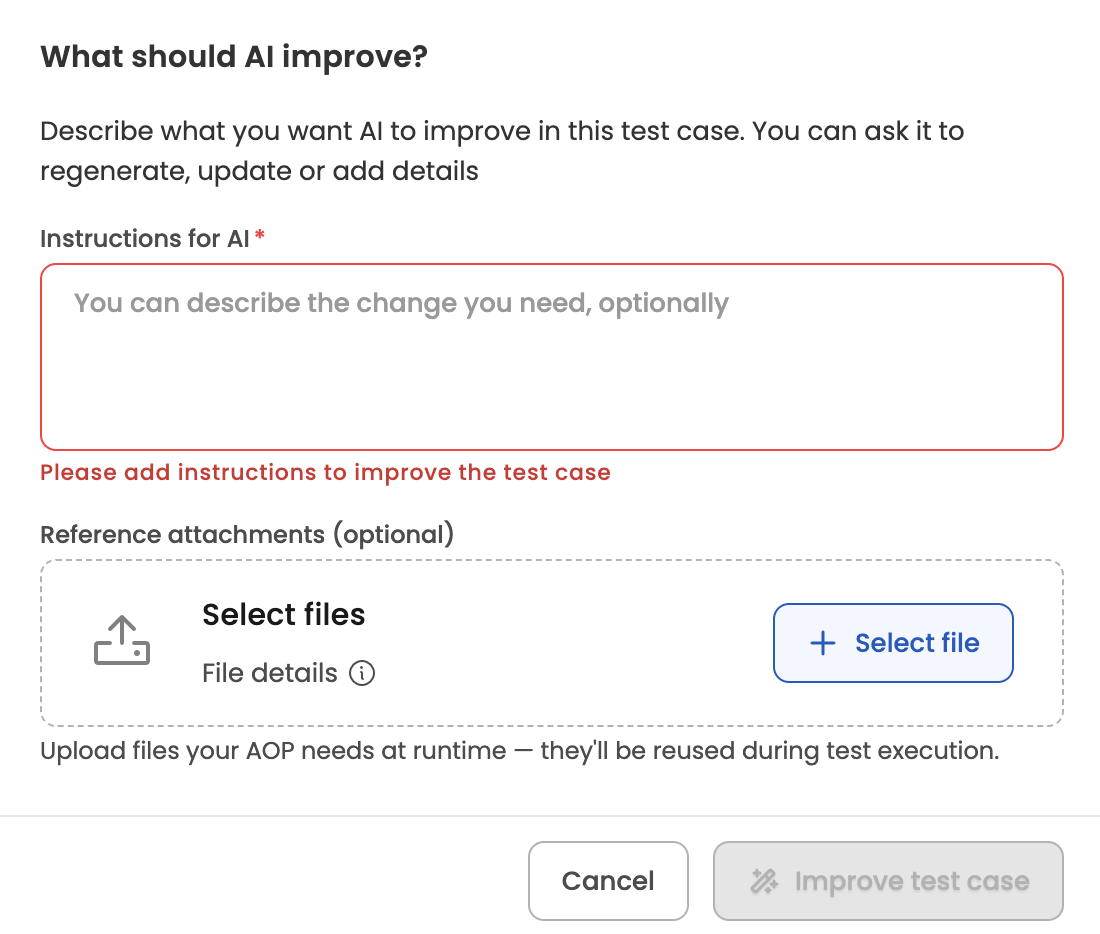
- Improve test case — re-run the generator for this single test case with new instructions and/or attachments. The test case moves back to In Progress while the new trajectory is produced.
- Delete — soft-delete the test case and all its trajectories.
TipTool-call outputs are the single biggest lever for making evaluations realistic. Spend time making sure the data returned by each mocked tool looks like what the real integration would return — the AOP's decisions are only as good as the data it sees.
Per-AOP limits
- Up to 100 test cases per AOP
- Up to 10 test cases per generation request
- Up to 20 test cases generating concurrently per AOP
Eval Metrics
Six pre-defined metrics are applied to every evaluation run. Metric names, pass criteria, and fail criteria are consistent across all AOPs on the platform.
| Metric | Pass if… | Fail if… |
|---|---|---|
| Hallucination | Every data point is traceable to tool outputs, user input, system records, or conversation context | The agent produced information, data, links, or recommendations that cannot be traced back |
| All Items Processed | Every item returned by tool outputs that needed processing was fully handled | Items were silently skipped or dropped (e.g., 3 documents returned but only 2 processed) |
| Steps in Right Order | The AOP workflow executed in the correct sequence with no skipped or invented steps (except where conditionally allowed) | Steps executed out of order, required steps skipped, or questions asked outside the AOP or tool schemas |
| Right Tool calls, Right Parameters | Correct skills and tools invoked with valid parameters; approvals and loops routed correctly | Wrong skills called, wrong or fabricated parameters, approvals to wrong recipients, or loops that miss or duplicate items |
| Clean User Communications | User-facing messages are clear, complete, and well-formatted | Malformed markdown, raw links, or internal identifiers visible to users |
| Expected Outcome Achieved | The test case's intended goal was fully delivered | The goal was not achieved, the process was incomplete, or a different outcome was delivered |
NoteEach metric is judged independently and reported as Pass or Fail. An execution doesn't carry a Pass / Fail label of its own — its outcome is summarised as
Overall pass %plus the per-metric breakdown. See How pass rate is calculated. Metric names, pass/fail criteria, and the set of metrics themselves are fixed at the platform level and not user-configurable.
How pass rate is calculated
Pass rate rolls up through three levels — execution, test case, and run. The same calculation is used everywhere; only the population being averaged changes.
Execution level — shown as Overall pass %
For a single execution:
Overall pass % = (passed metrics / (passed metrics + failed metrics)) × 100
This is the same N passed / N failed shown in the Metrics column, expressed as a percentage.
The execution row itself shows only this percentage and the underlying N passed / N failed metric counts — there is no Pass / Fail label for the execution as a whole. The one exception is when the system couldn't evaluate the execution, in which case the Metrics column shows a System error label instead of the counts.
Test case level — shown as Avg pass rate (test-case-within-run page) and Overall pass % (Test cases table on the run page)
Mean of Overall pass % across the test case's iterations in the run, rounded to one decimal place:
Avg pass rate = Σ(execution pass %) / iteration count
Run level — shown as Avg pass rate (run detail page stat card)
Mean of Overall pass % across every execution in the run (every test case × iteration):
Avg pass rate = Σ(execution pass %) / total executions
Each execution carries equal weight — a test case with more iterations contributes more datapoints to the run average, but no per-test-case normalisation is applied.
Running an evaluation
Watch the tutorial
Run evaluation on the Test cases tab is a split button with two options:
- All test cases — runs every published test case for the AOP.
- Specific test cases — enters selection mode, where you tick the test cases you want and click Run Test on the floating action bar.
Only published test cases can be selected — in-progress, failed, and needs-input test cases are disabled with a tooltip.
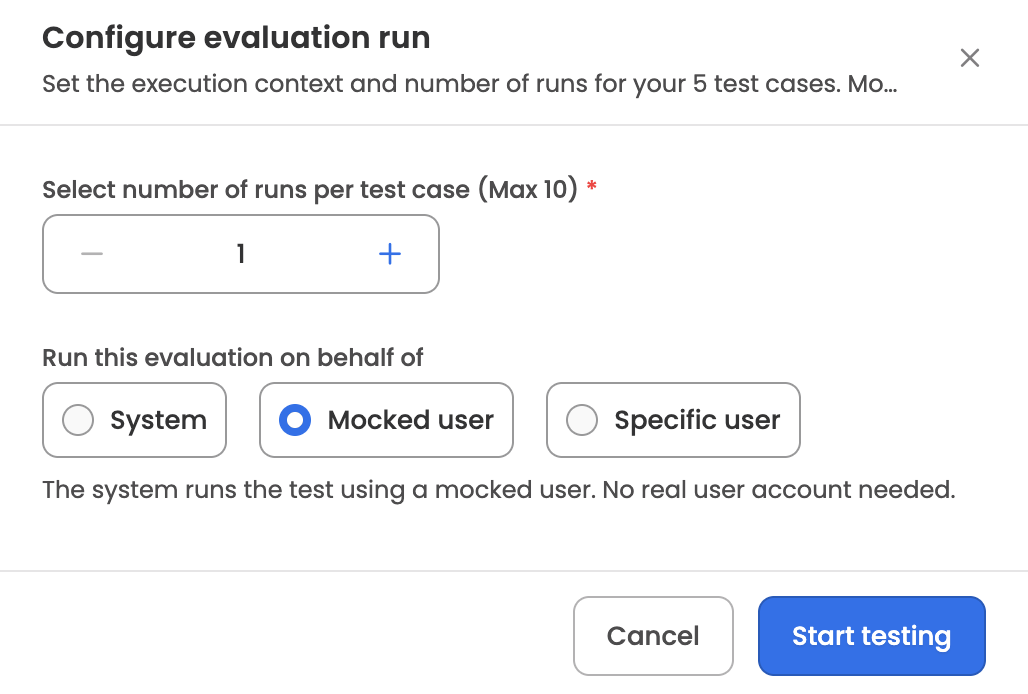
Once you've chosen what to run, the Run evaluation modal opens with two configuration options:
- Iterations — how many times each test case runs. Minimum 1, maximum 10, default 1. Multiple iterations help surface non-deterministic behaviour.
- Run on behalf of — sets the user context for the execution. Three options:
- System — runs without user context. Permissions and personalised data access aren't applied.
- Mocked user — runs against a mocked user profile. Use when the AOP needs some user context but you don't want results tied to a real employee.
- Specific user — selecting this reveals a Run as field for searching the employee directory. The evaluation runs in that employee's context — role, location, and data scope — which matters for AOPs whose behaviour depends on the initiator.
The set of options visible depends on the AOP version's manual and Workbench execution permissions; options the AOP doesn't support are hidden.
On submit, the system creates an evaluation run with a sequential ID per AOP in the format RUN_000001, snapshots the AOP version under test (the latest draft or active version at run time), locks the selected test cases against edits, and begins executing. Each execution is given its own reference ID in the format RUN_000001-E001.
What happens during a run
For each test case × iteration combination, the system:
- Opens an isolated conversation with the AOP executor using the test case's initiation message.
- Replays the saved trajectory — mocked tool outputs are injected, and a simulated user drives the conversation through any remaining turns.
- Captures the actual conversation, agent decisions, and tool calls.
- Scores every eval metric against the captured execution using the LLM-judge, producing a Pass or Fail result with reasoning for each metric.
- Generates a markdown summary of the execution covering overall performance, key findings, and recommendations.
The run is complete when every execution has reached a terminal state.
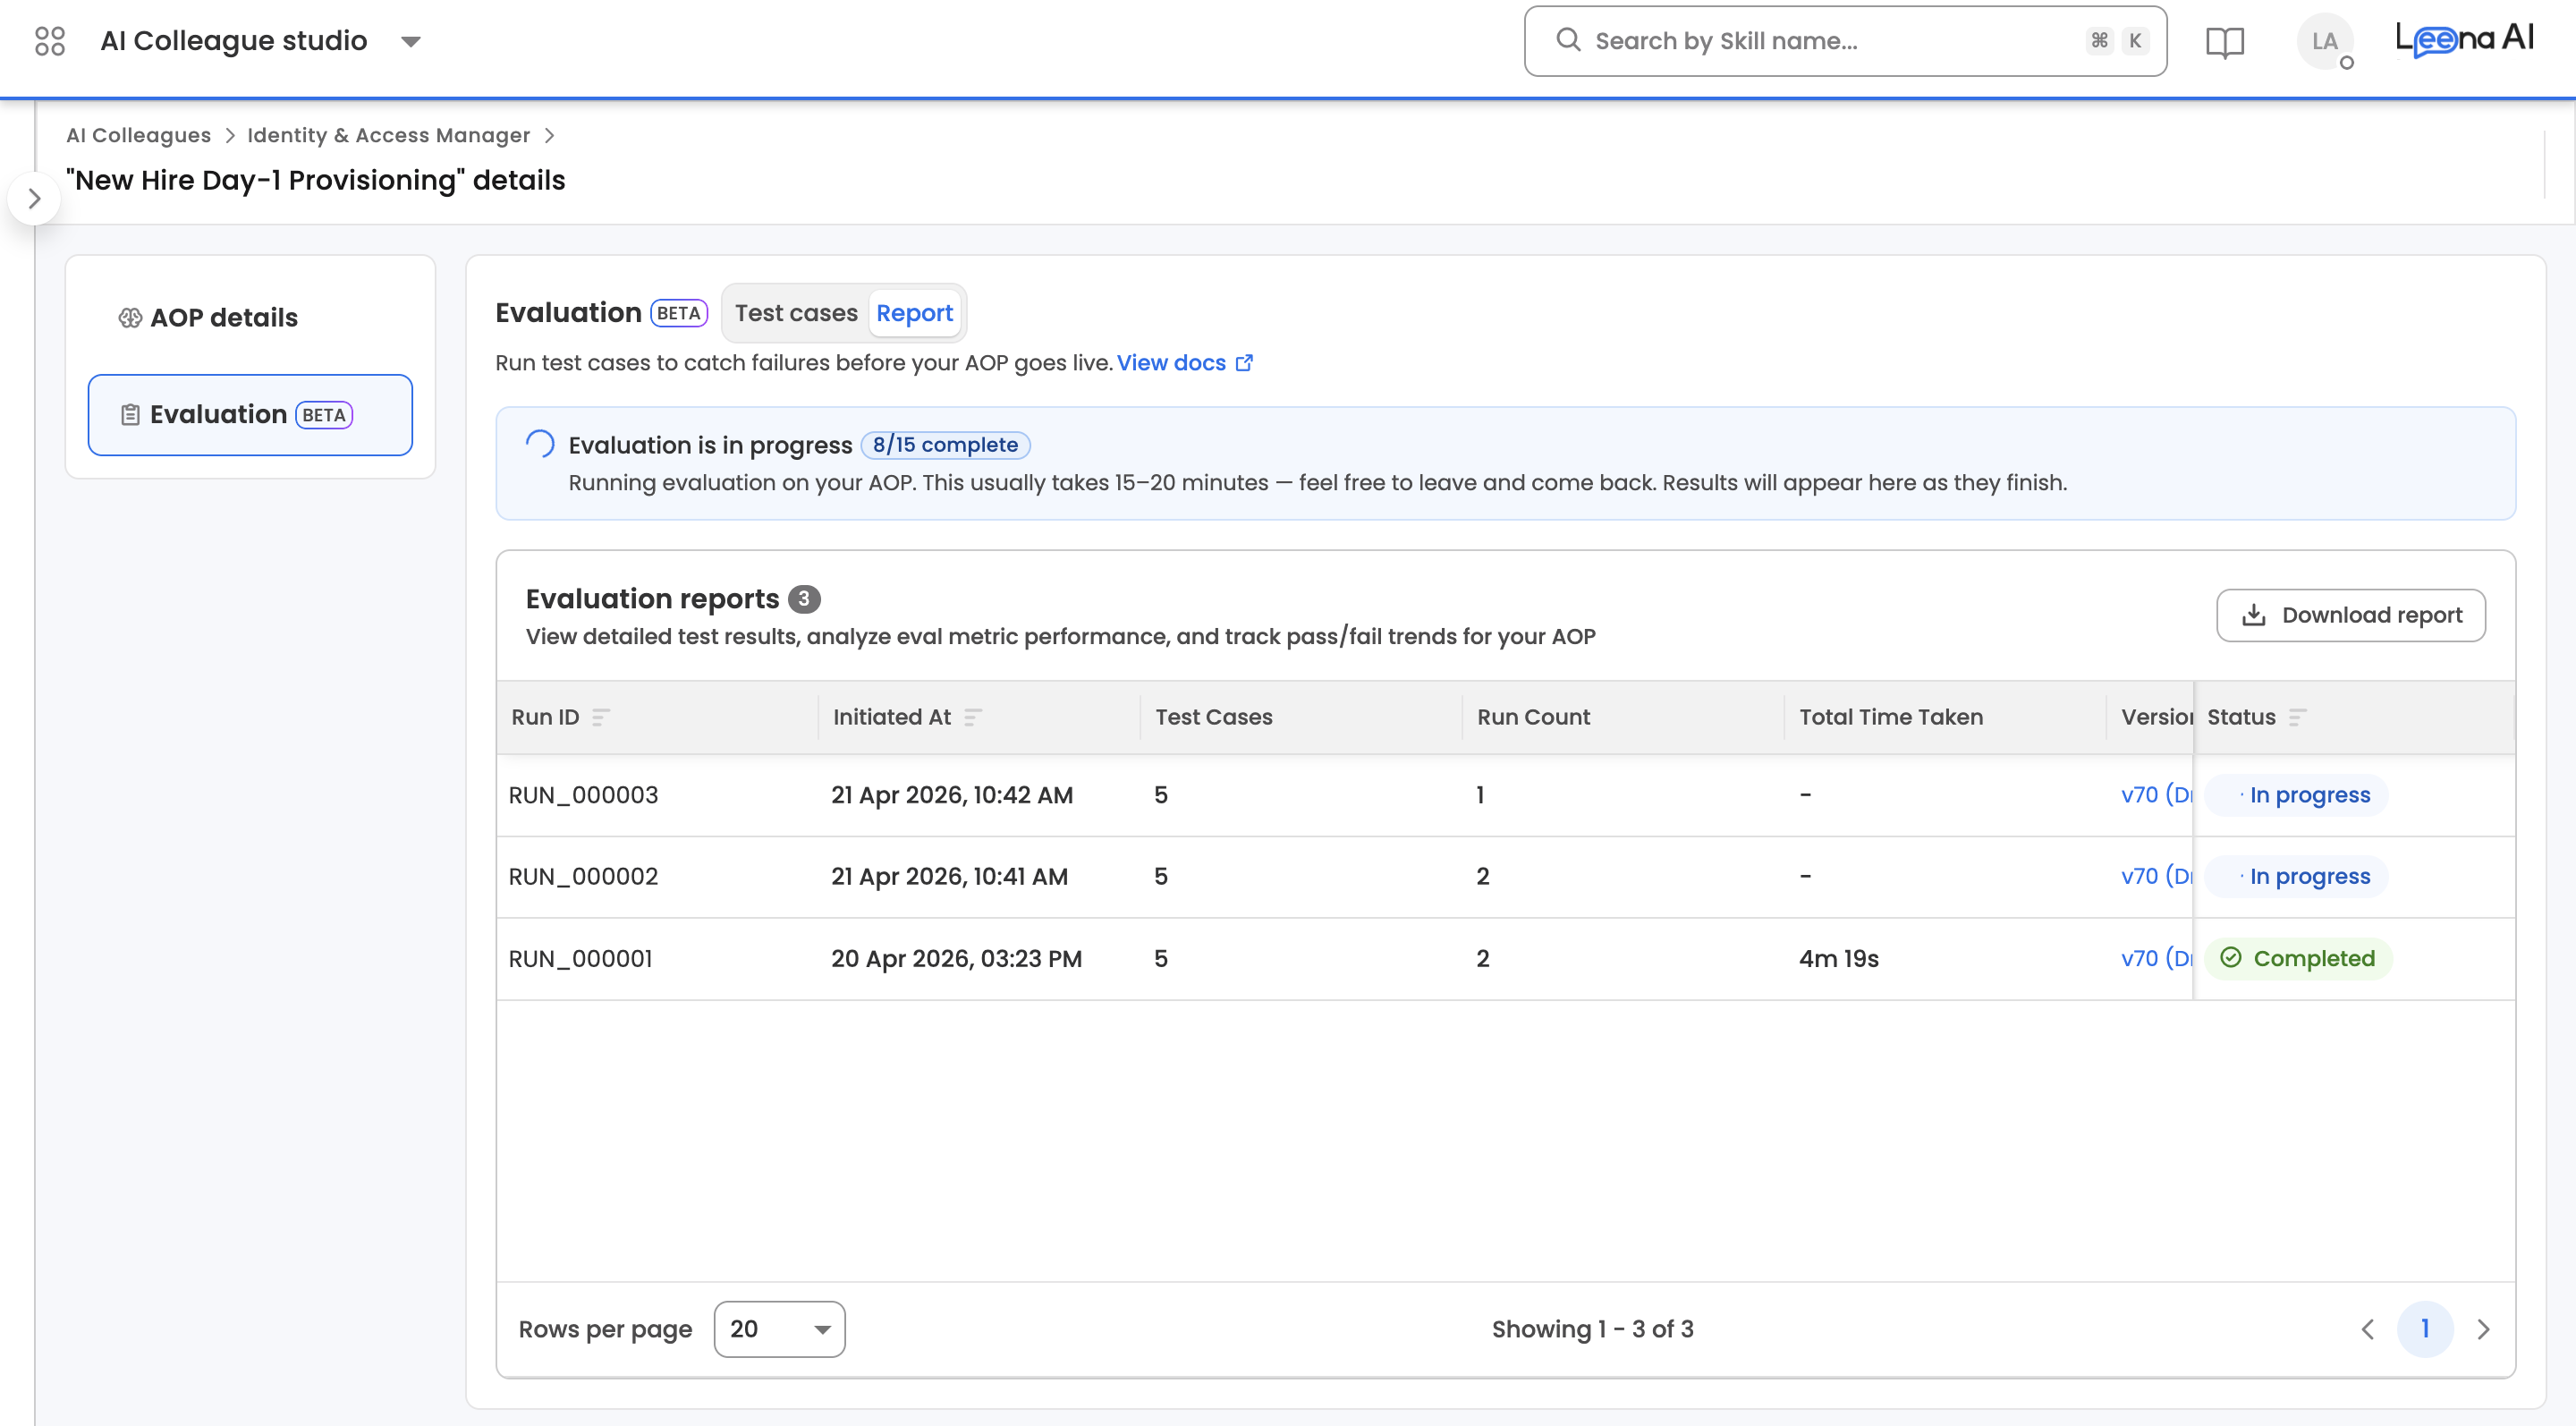
While the run is in progress, the Report tab shows a progress banner with a completed/total execution count. Evaluations typically take 15–20 minutes. You can leave the page and come back — results populate as executions finish.
Report
The Report sub-tab lists every evaluation run for the AOP and lets authors drill into run-level results, test-case aggregates within a run, and individual execution detail.
Report list
Each run in the list shows its run ID (RUN_000001), when it was started, which AOP version was tested, the number of test cases included, the run's overall pass rate, total duration, who initiated it, and its status (Pending / Running / Completed / Failed). The list supports sorting by start date, run ID, status, pass rate, or number of test cases.
NoteA run is marked Failed only when every execution in it hit a system error. Criteria failures within individual executions do not fail the run — they're reflected in the pass rate. Use the pass rate, not the run status, to judge the health of an evaluation.
Report detail view (run level)
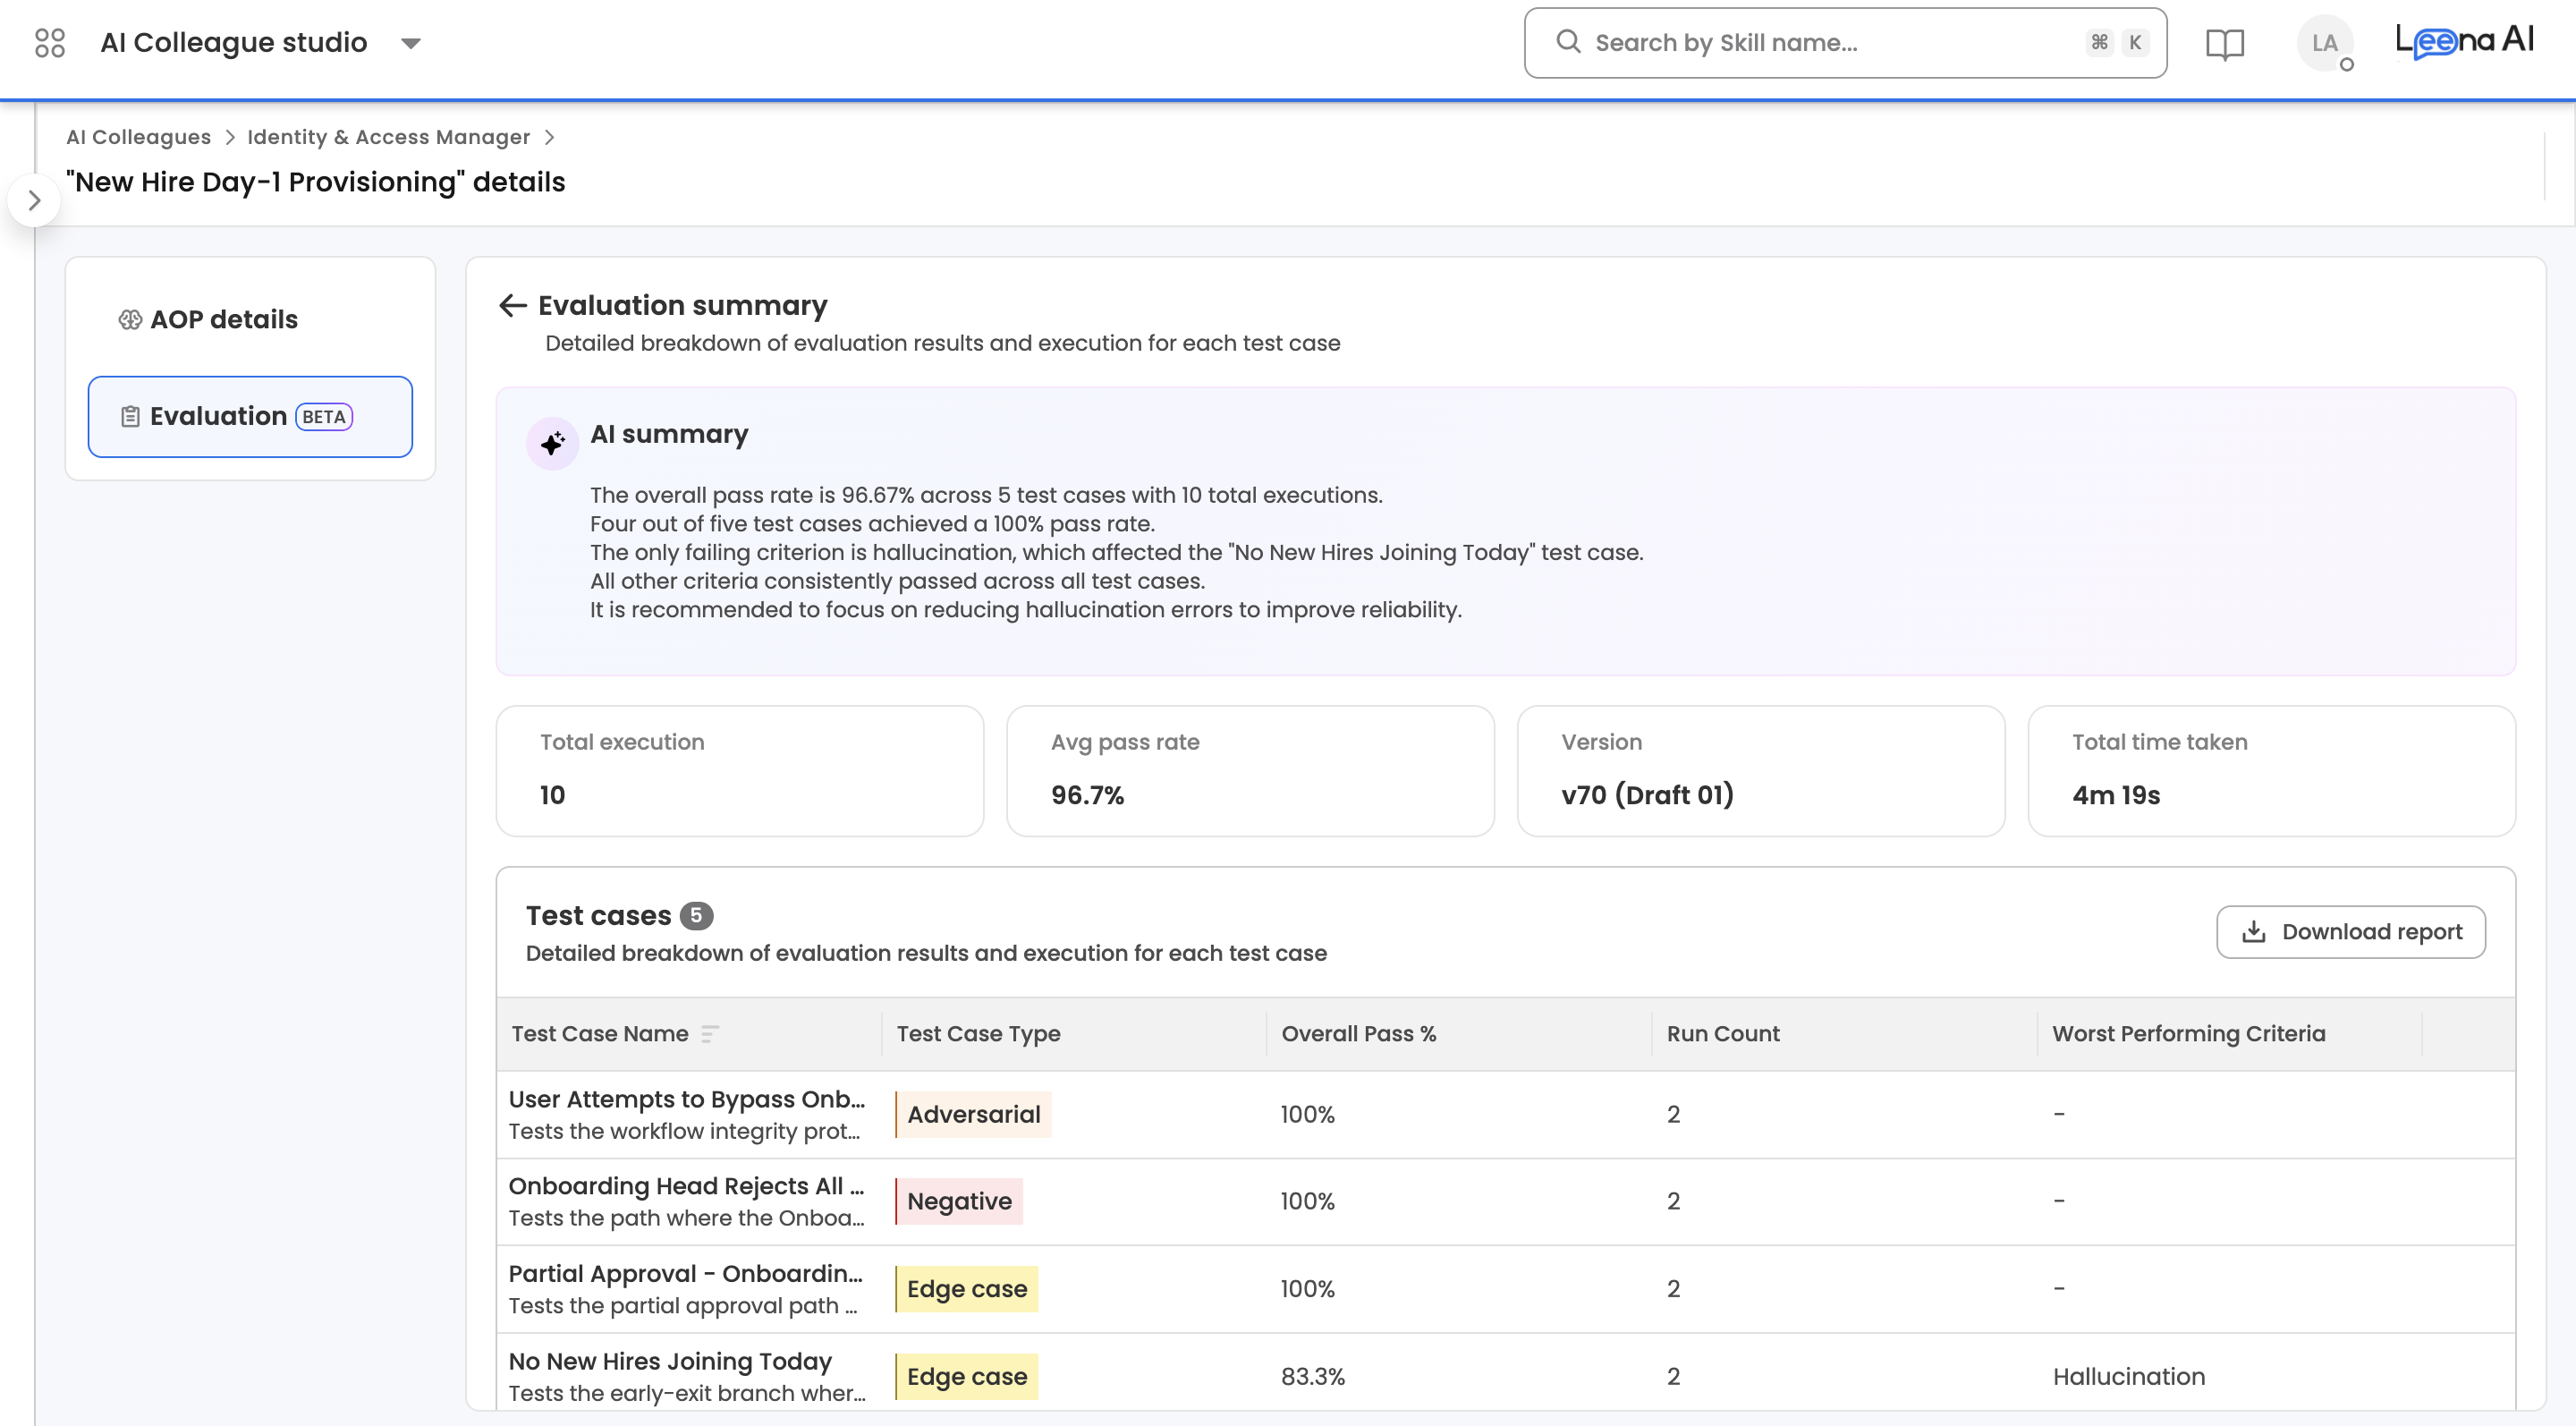
Clicking a run opens an Evaluation summary page with run-level aggregates and the test cases that were executed in that run.
AI summary — an LLM-generated paragraph at the top of the page summarising how the run went overall (pass rate, which test cases failed, which criteria were most problematic, and a brief recommendation). Shown only when a summary is available.
Stat cards — four cards across the top of the page:
| Stat | What it shows |
|---|---|
| Run count | Total number of executions in the run (test cases × iterations) |
| Avg pass rate | Mean of Overall pass % across every execution in the run. See How pass rate is calculated. |
| Version | AOP version the run was executed against. Click it to open the AOP version details. |
| Total time taken | End-to-end duration of the run |
Test cases table — every test case included in the run, with the following columns:
| Column | Description |
|---|---|
| Test case name | Test case name with a short description below |
| Type | Happy path, Edge case, Negative, or Adversarial |
| Overall pass % | Aggregate pass rate for this test case across all its iterations |
| Run count | Number of iterations run for this test case |
| Worst performing criteria(s) | The eval metric that failed most often for this test case across its iterations, or - if all criteria passed |
A Download report button in the table header exports the run's data as .xlsx.
Clicking any row in the Test cases table drills into the test-case-within-report view.
NoteIf the run is still Pending or Running, this page shows an "Evaluation is in progress" illustration instead of the stats and table. Come back once the run completes.
Test case detail within a run (test-case level)
This page shows aggregate metrics for a single test case across all its iterations in the run, plus a list of the individual executions.
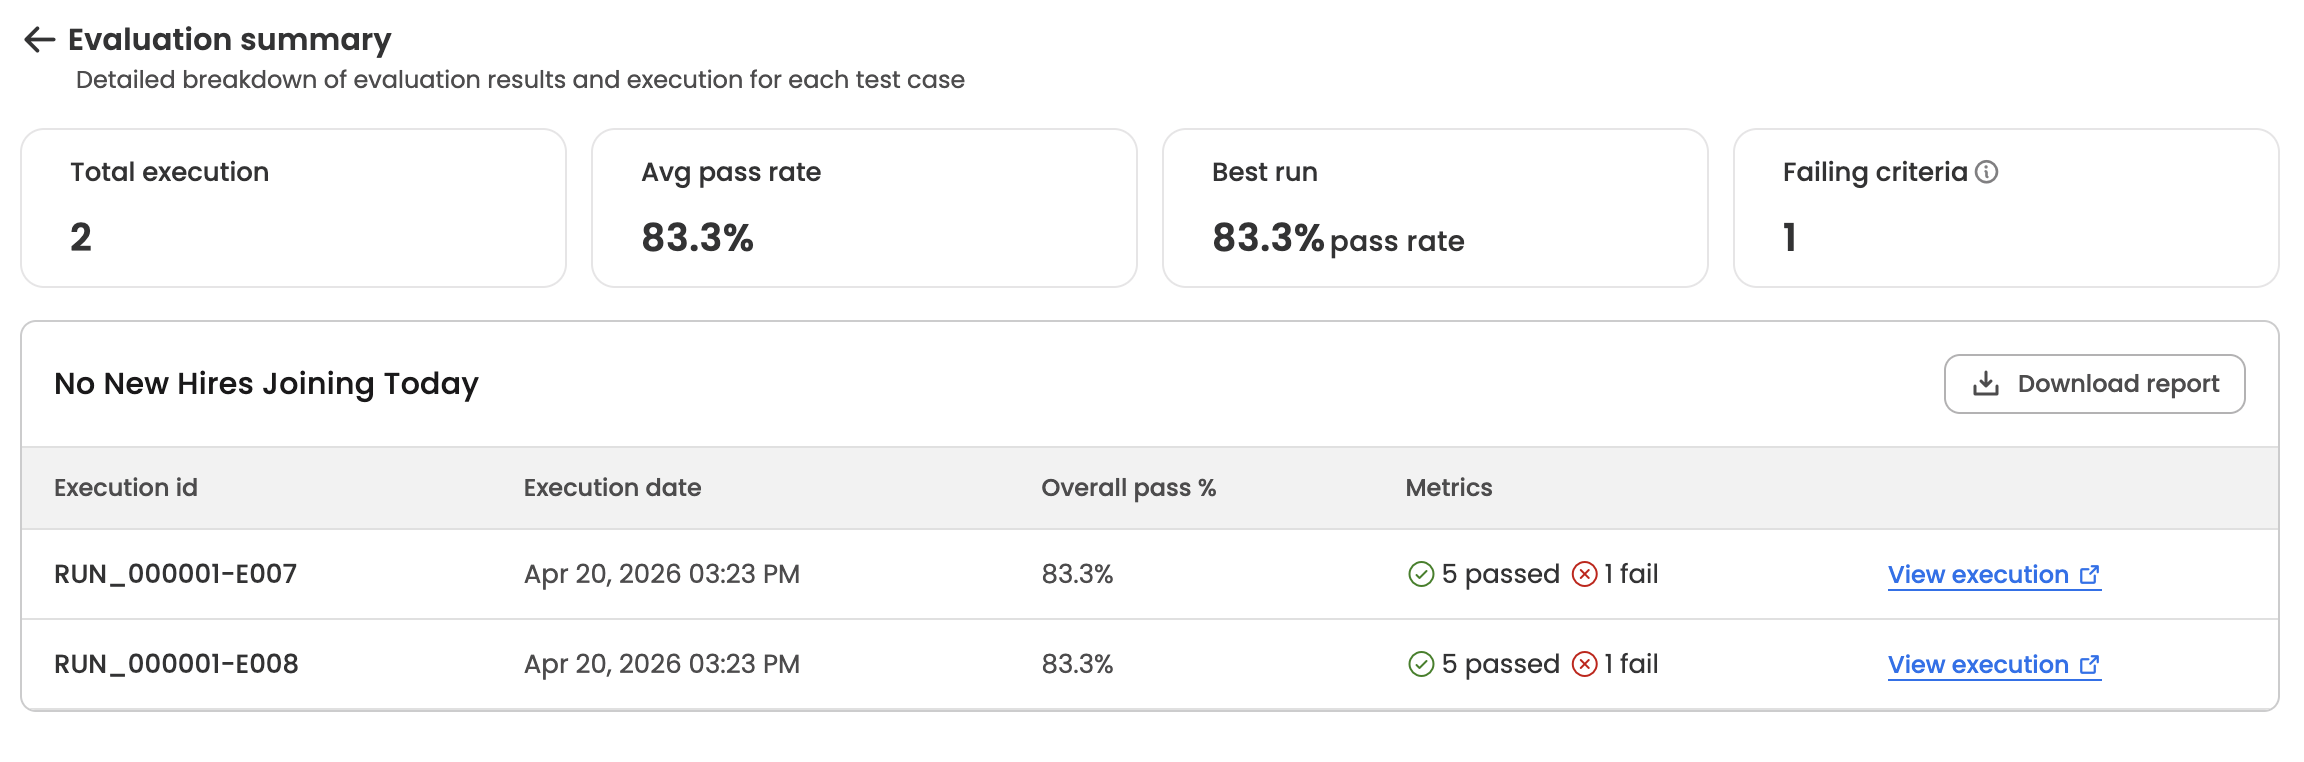
Stat cards:
| Stat | What it shows |
|---|---|
| Run count | Number of iterations of this test case in the run |
| Avg pass rate | Mean of Overall pass % across this test case's iterations in the run. |
| Best run | The highest per-iteration pass rate, labelled with "pass rate" |
| Worst run | The lowest per-iteration pass rate. Shown only when the worst run differs from the best run — if all iterations had the same pass rate, this card is hidden. |
| Failing criteria | Count of distinct eval criteria that failed at least once across the iterations. Includes an info tooltip explaining the metric. |
Executions table — titled with the test case name, with the following columns:
| Column | Description |
|---|---|
| Execution id | Execution reference in the format RUN_000001-E007 |
| Initiated at | When the execution started |
| Overall pass % | Pass rate for this single execution. Shows - while the execution is still running. |
| Metrics | N passed (green check) and N failed (red X) side by side. If the execution hit a system error before criteria could be evaluated, this column shows a System error label with a warning icon instead of the passed/failed counts. |
| — | View run history link on the right, which opens the full execution in the Run History page in a new tab. |
A Download report button in the header exports this test case's execution data as .xlsx.
Clicking anywhere on an execution row (except the View run history link) opens the Run summary modal.
Run summary modal (execution level)
Opened by clicking an execution row. The modal header shows the execution ID and test case name (e.g., RUN_000001-E007 | No New Hires Joining Today). The body has up to three sections:
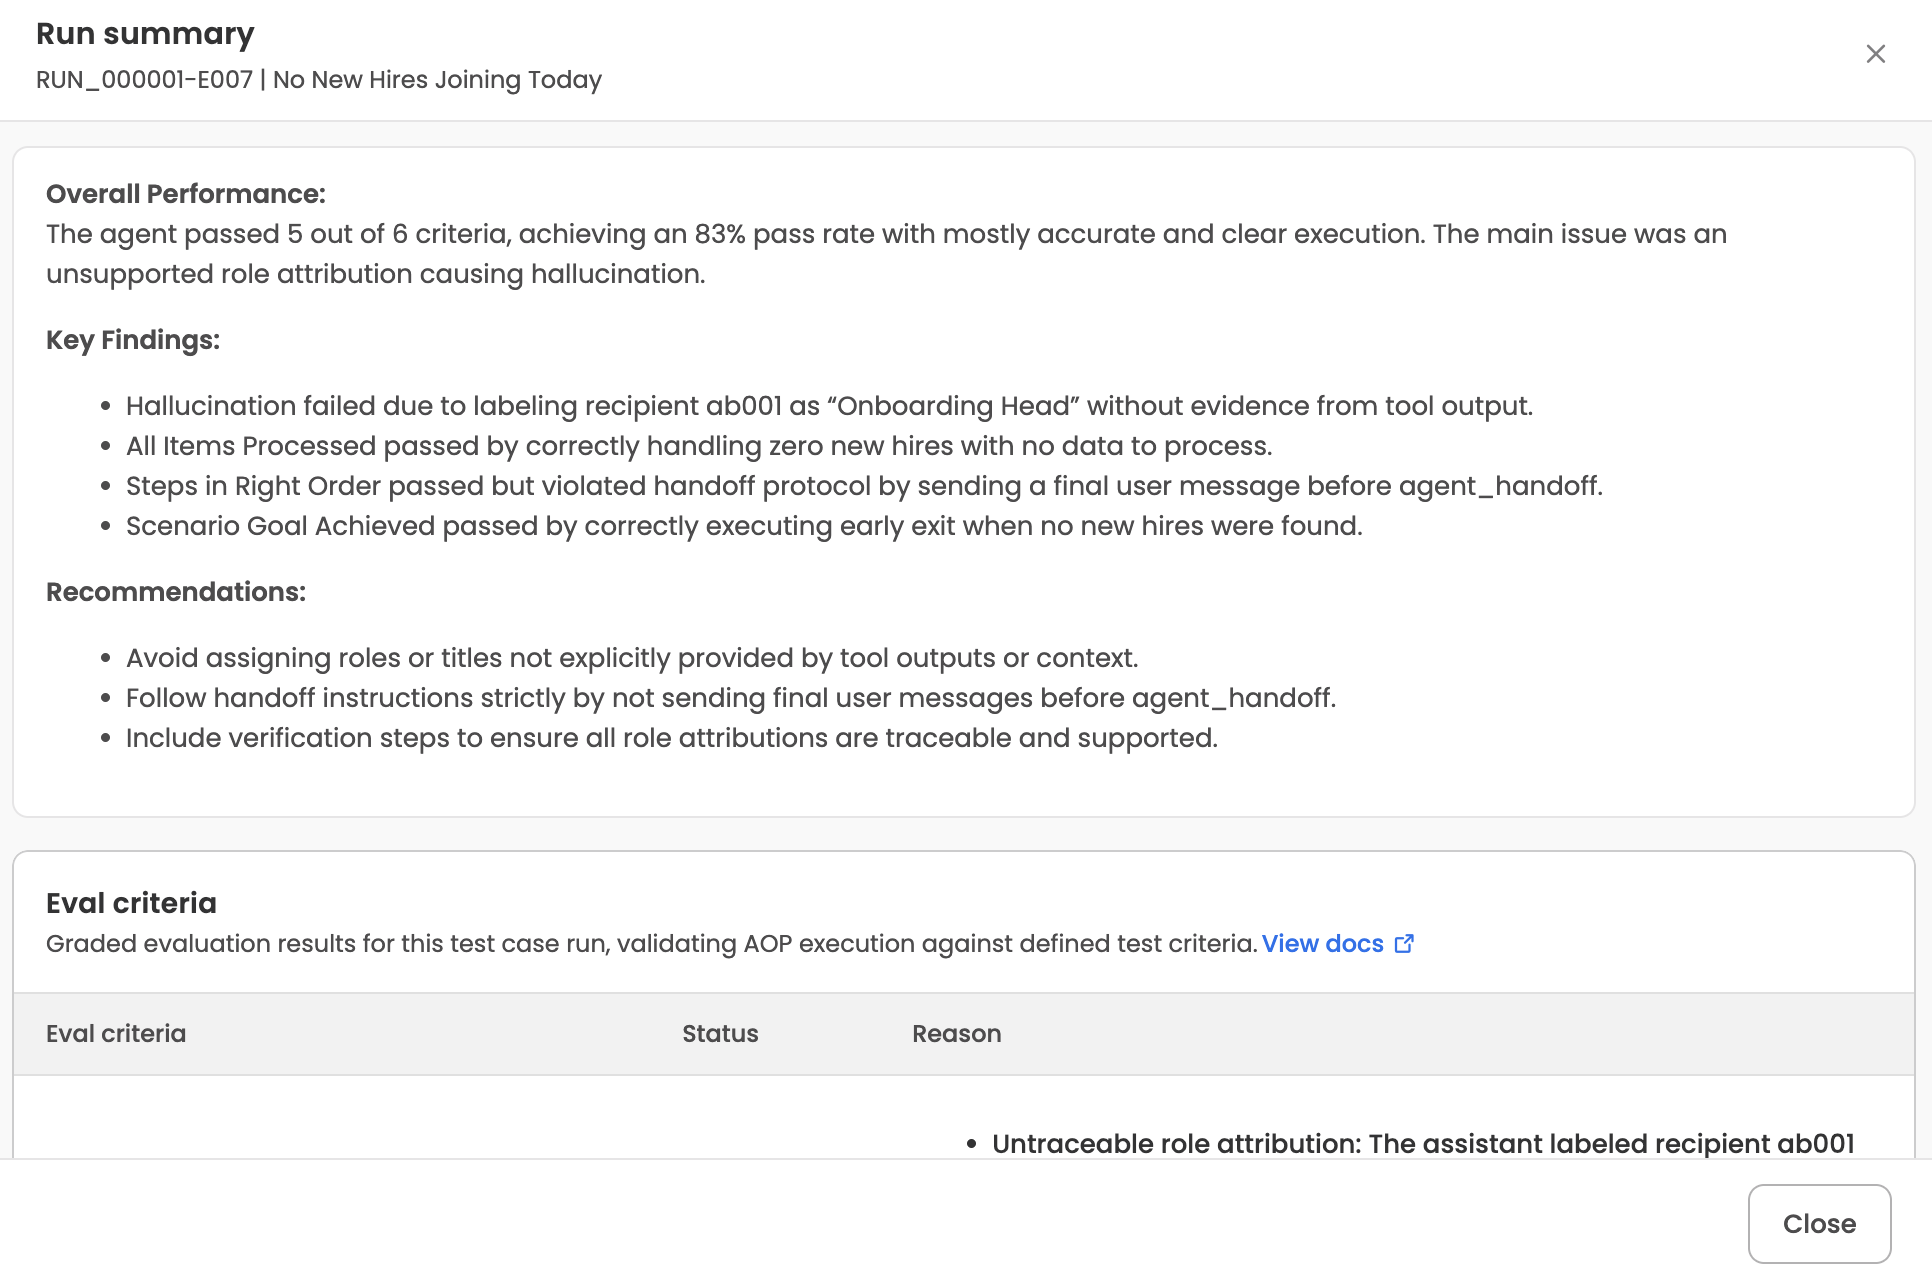
- Summary — the LLM-generated markdown summary of this specific execution. Shown when a summary is available.
- Failure reason — only populated when the execution hit a system error (the same condition that surfaces as System error in the executions table).
- Eval criteria — a table of every eval metric evaluated for this execution, with three columns:
- Criteria — the metric name.
- Status — Pass (green) or Fail (red).
- Reason — the evaluator's natural-language reasoning, rendered as markdown.
A View docs link next to the Eval criteria table opens the Eval metrics documentation in a new tab.
To see the full conversation and tool calls for the execution, use the View run history link in the executions table — it opens the Run History page for that execution's underlying request, where the complete trajectory is available.
Exports
Report data can be exported as .xlsx from two levels:
- A single run — from the Download report button on the run detail page. Exports all test cases and their execution data for the run.
- A single test case within a run — from the Download report button on the test-case detail page. Exports all iterations of that test case.
Exports run asynchronously. The UI shows progress while the file is being prepared, then surfaces a download link once it's ready.