
Setting up Performance Insights
This page walks through configuring a report for an AOP, reviewing the report Performance Insights proposes, and reading it once data starts flowing. Setting a report up does not require any SQL, schema definition, or per-run configuration — you point Performance Insights at an AOP, review what it proposes, and accept it.
Before you start
- The AOP must already exist and be published.
- The AOP must have at least 5 eligible runs before a report can be configured. This requirement is enforced: until the AOP reaches it, Performance Insights cannot analyse the AOP or produce a report for you to accept. The Insights tab shows the progress toward it (for example
3 / 5), and the Configure report button becomes available once the count is met. The number is configurable per environment (default 5). - Performance Insights is available to dashboard users with AI Colleague management permissions.
What counts as an eligible run
Not every run counts toward the requirement. An eligible run is:
- Real, not eval — runs executed in eval or test mode do not count, and they are never captured into report data either.
- Terminal — the run reached a finished state (completed, failed, or aborted).
- Lineage-stamped — the run was recorded after parent-to-helper run linkage shipped to your environment.
The last point matters right after Performance Insights is rolled out to an environment: runs from before that point carry no linkage, so a report derived from them would be shaped by a picture of the AOP that was never fully recorded. Until new runs accumulate, an AOP can read 0 / 5 even though it has plenty of history. This is expected and resolves itself as the AOP runs.
Note: Some AOPs — a Q&A or lookup assistant that produces answers rather than records — have nothing measurable to report. For these, analysis returns "nothing measurable found" instead of a report. The verdict can be re-attempted after the AOP itself changes.
Note: Helper AOPs are not configured separately. A helper's data is captured into its parent's report, so a helper never gets a report of its own.
1. Configure a report
Accessing report setup
Open the AOP and go to its Insights tab. Once the run requirement is met, choose Configure report. You can also reach the same place from the Performance insights screen by opening any card under Ready for reporting.
Step 1 — Analysis
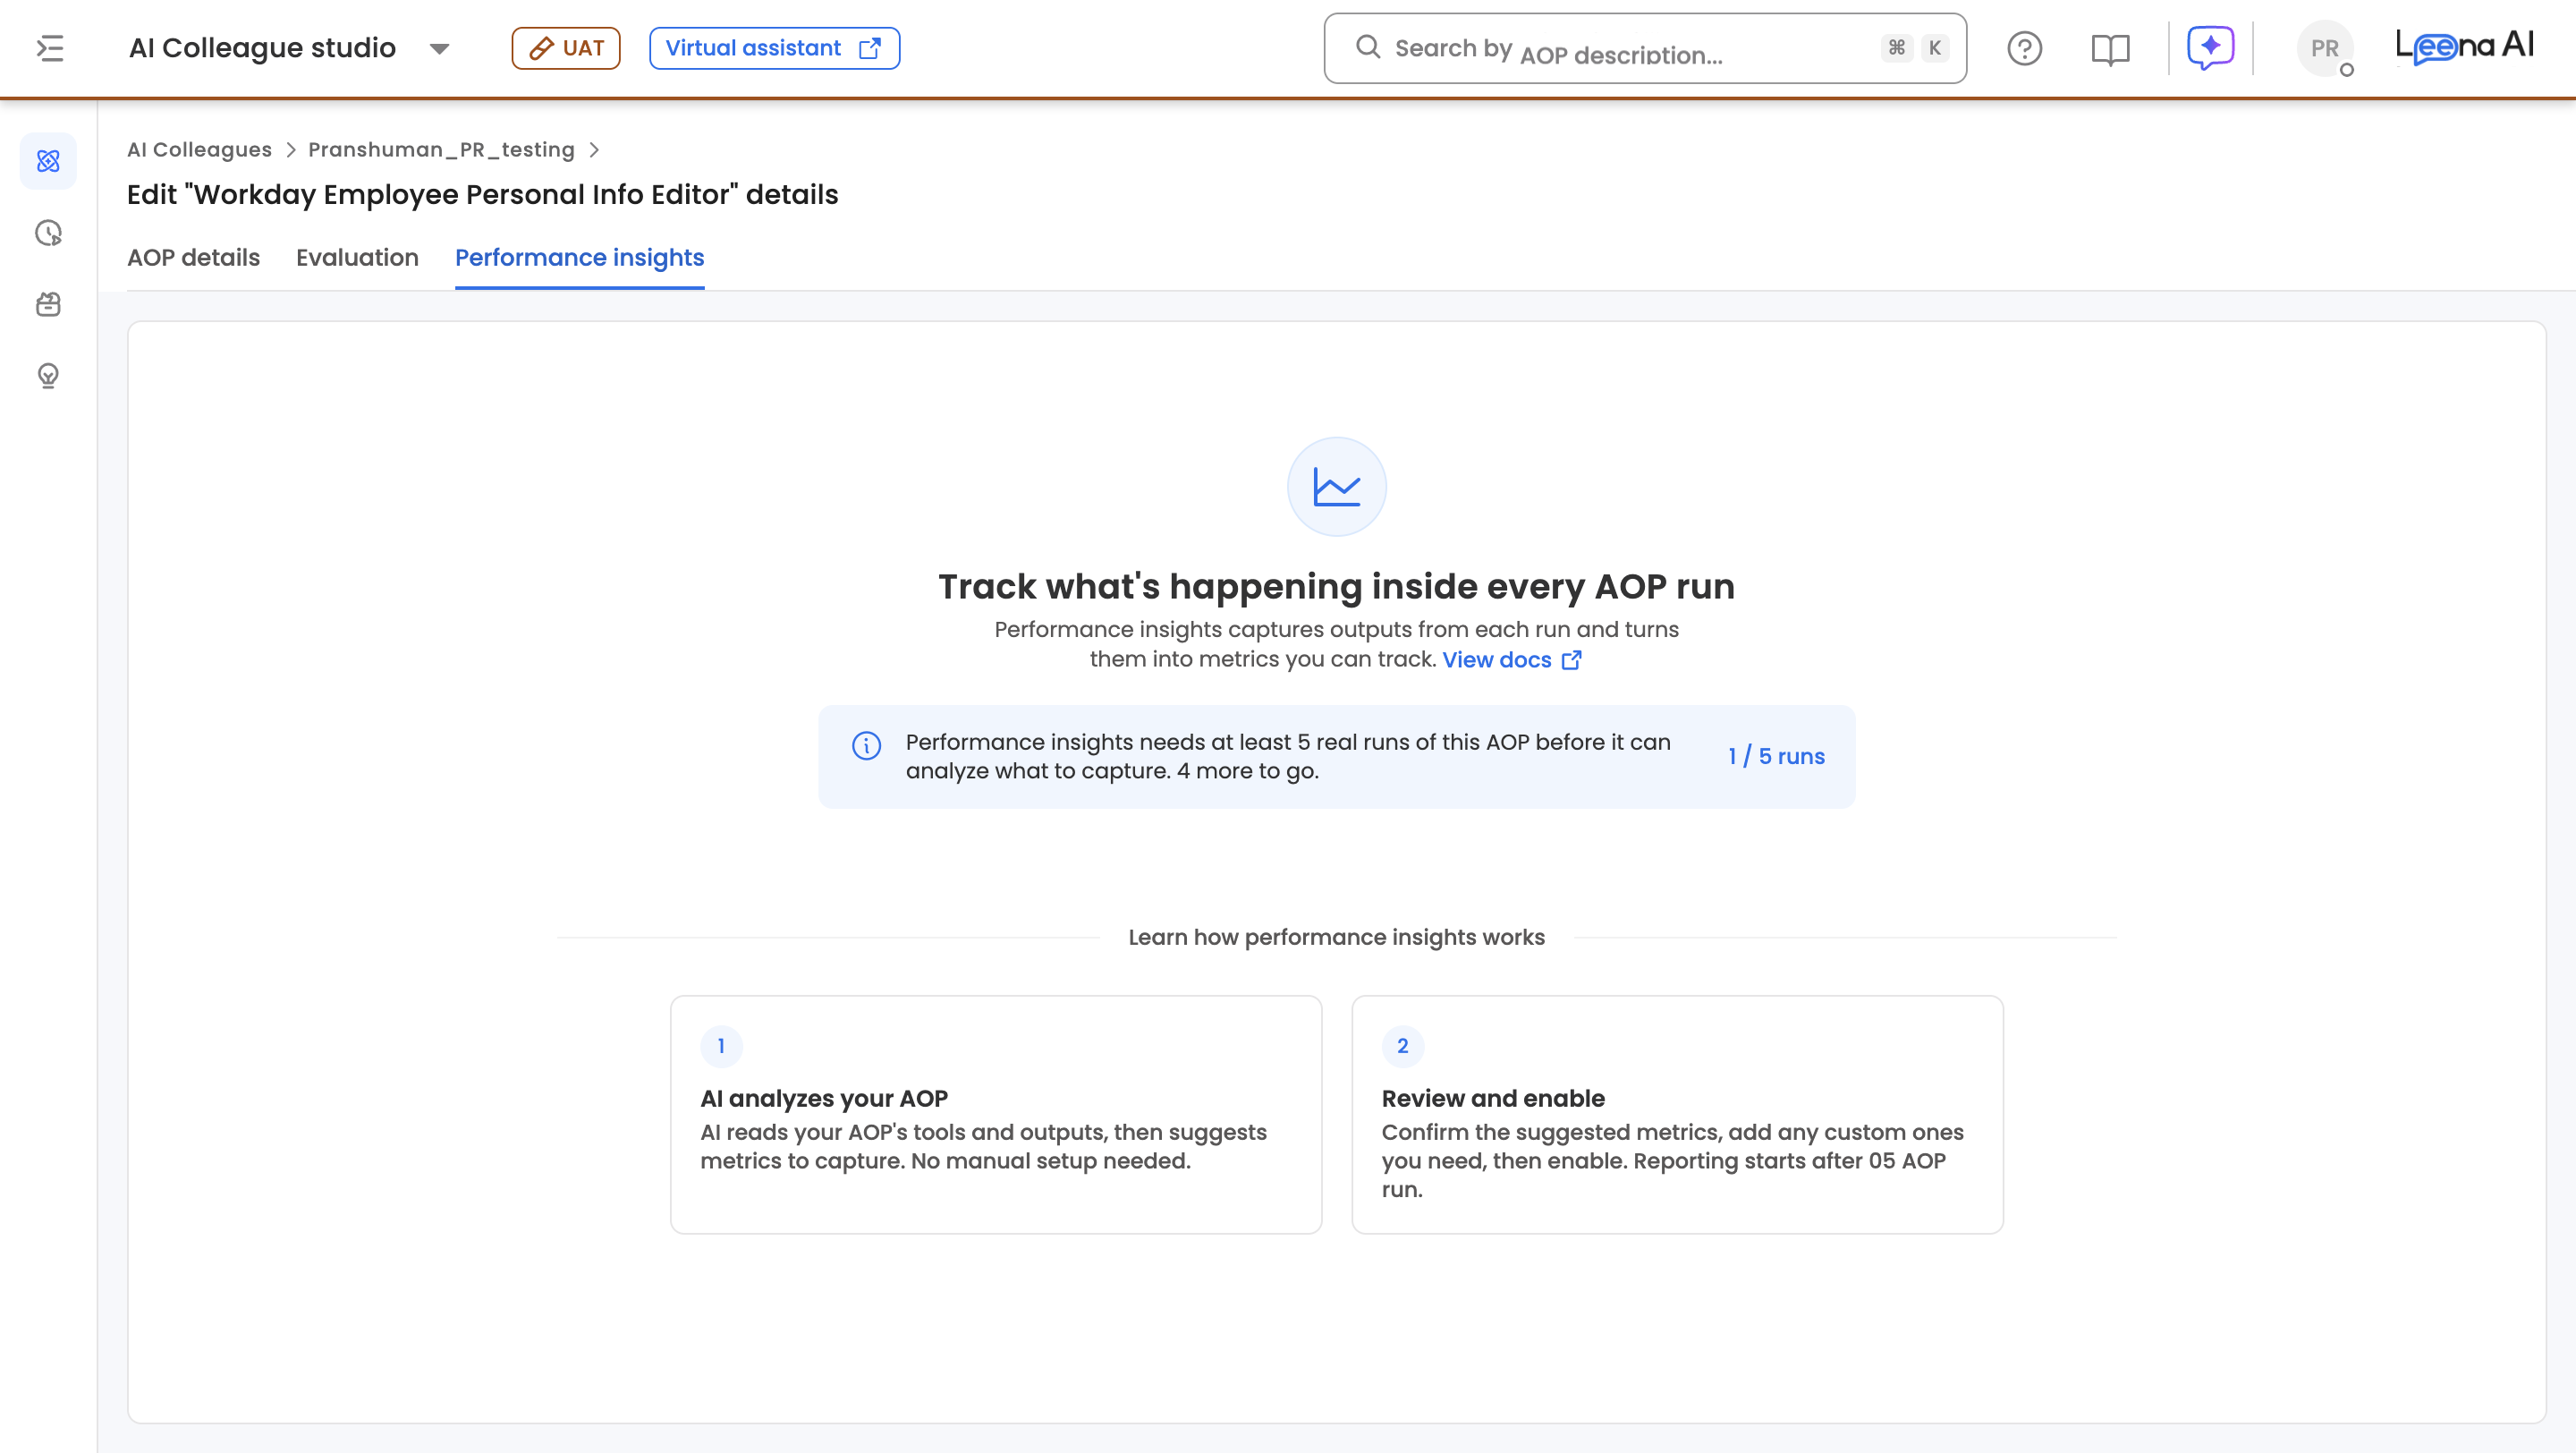
Performance Insights analyses the AOP: it reads the AOP's skills, its helper AOPs, and its eligible runs to work out what's worth reporting on. This runs in the background and usually completes in under a minute; the screen updates when it finishes.
During analysis the system decides three things:
- What the AOP reports on — a business thing such as an invoice, a vendor, or a claim, or, when there's no such thing, the run itself.
- What facts describe it — the columns to capture (for example
amount,final_status,approver), each with a note on how that value is pulled out of a run. - What's worth charting — the proposed insights, with the query behind each one written for you.
Step 2 — Review the preview
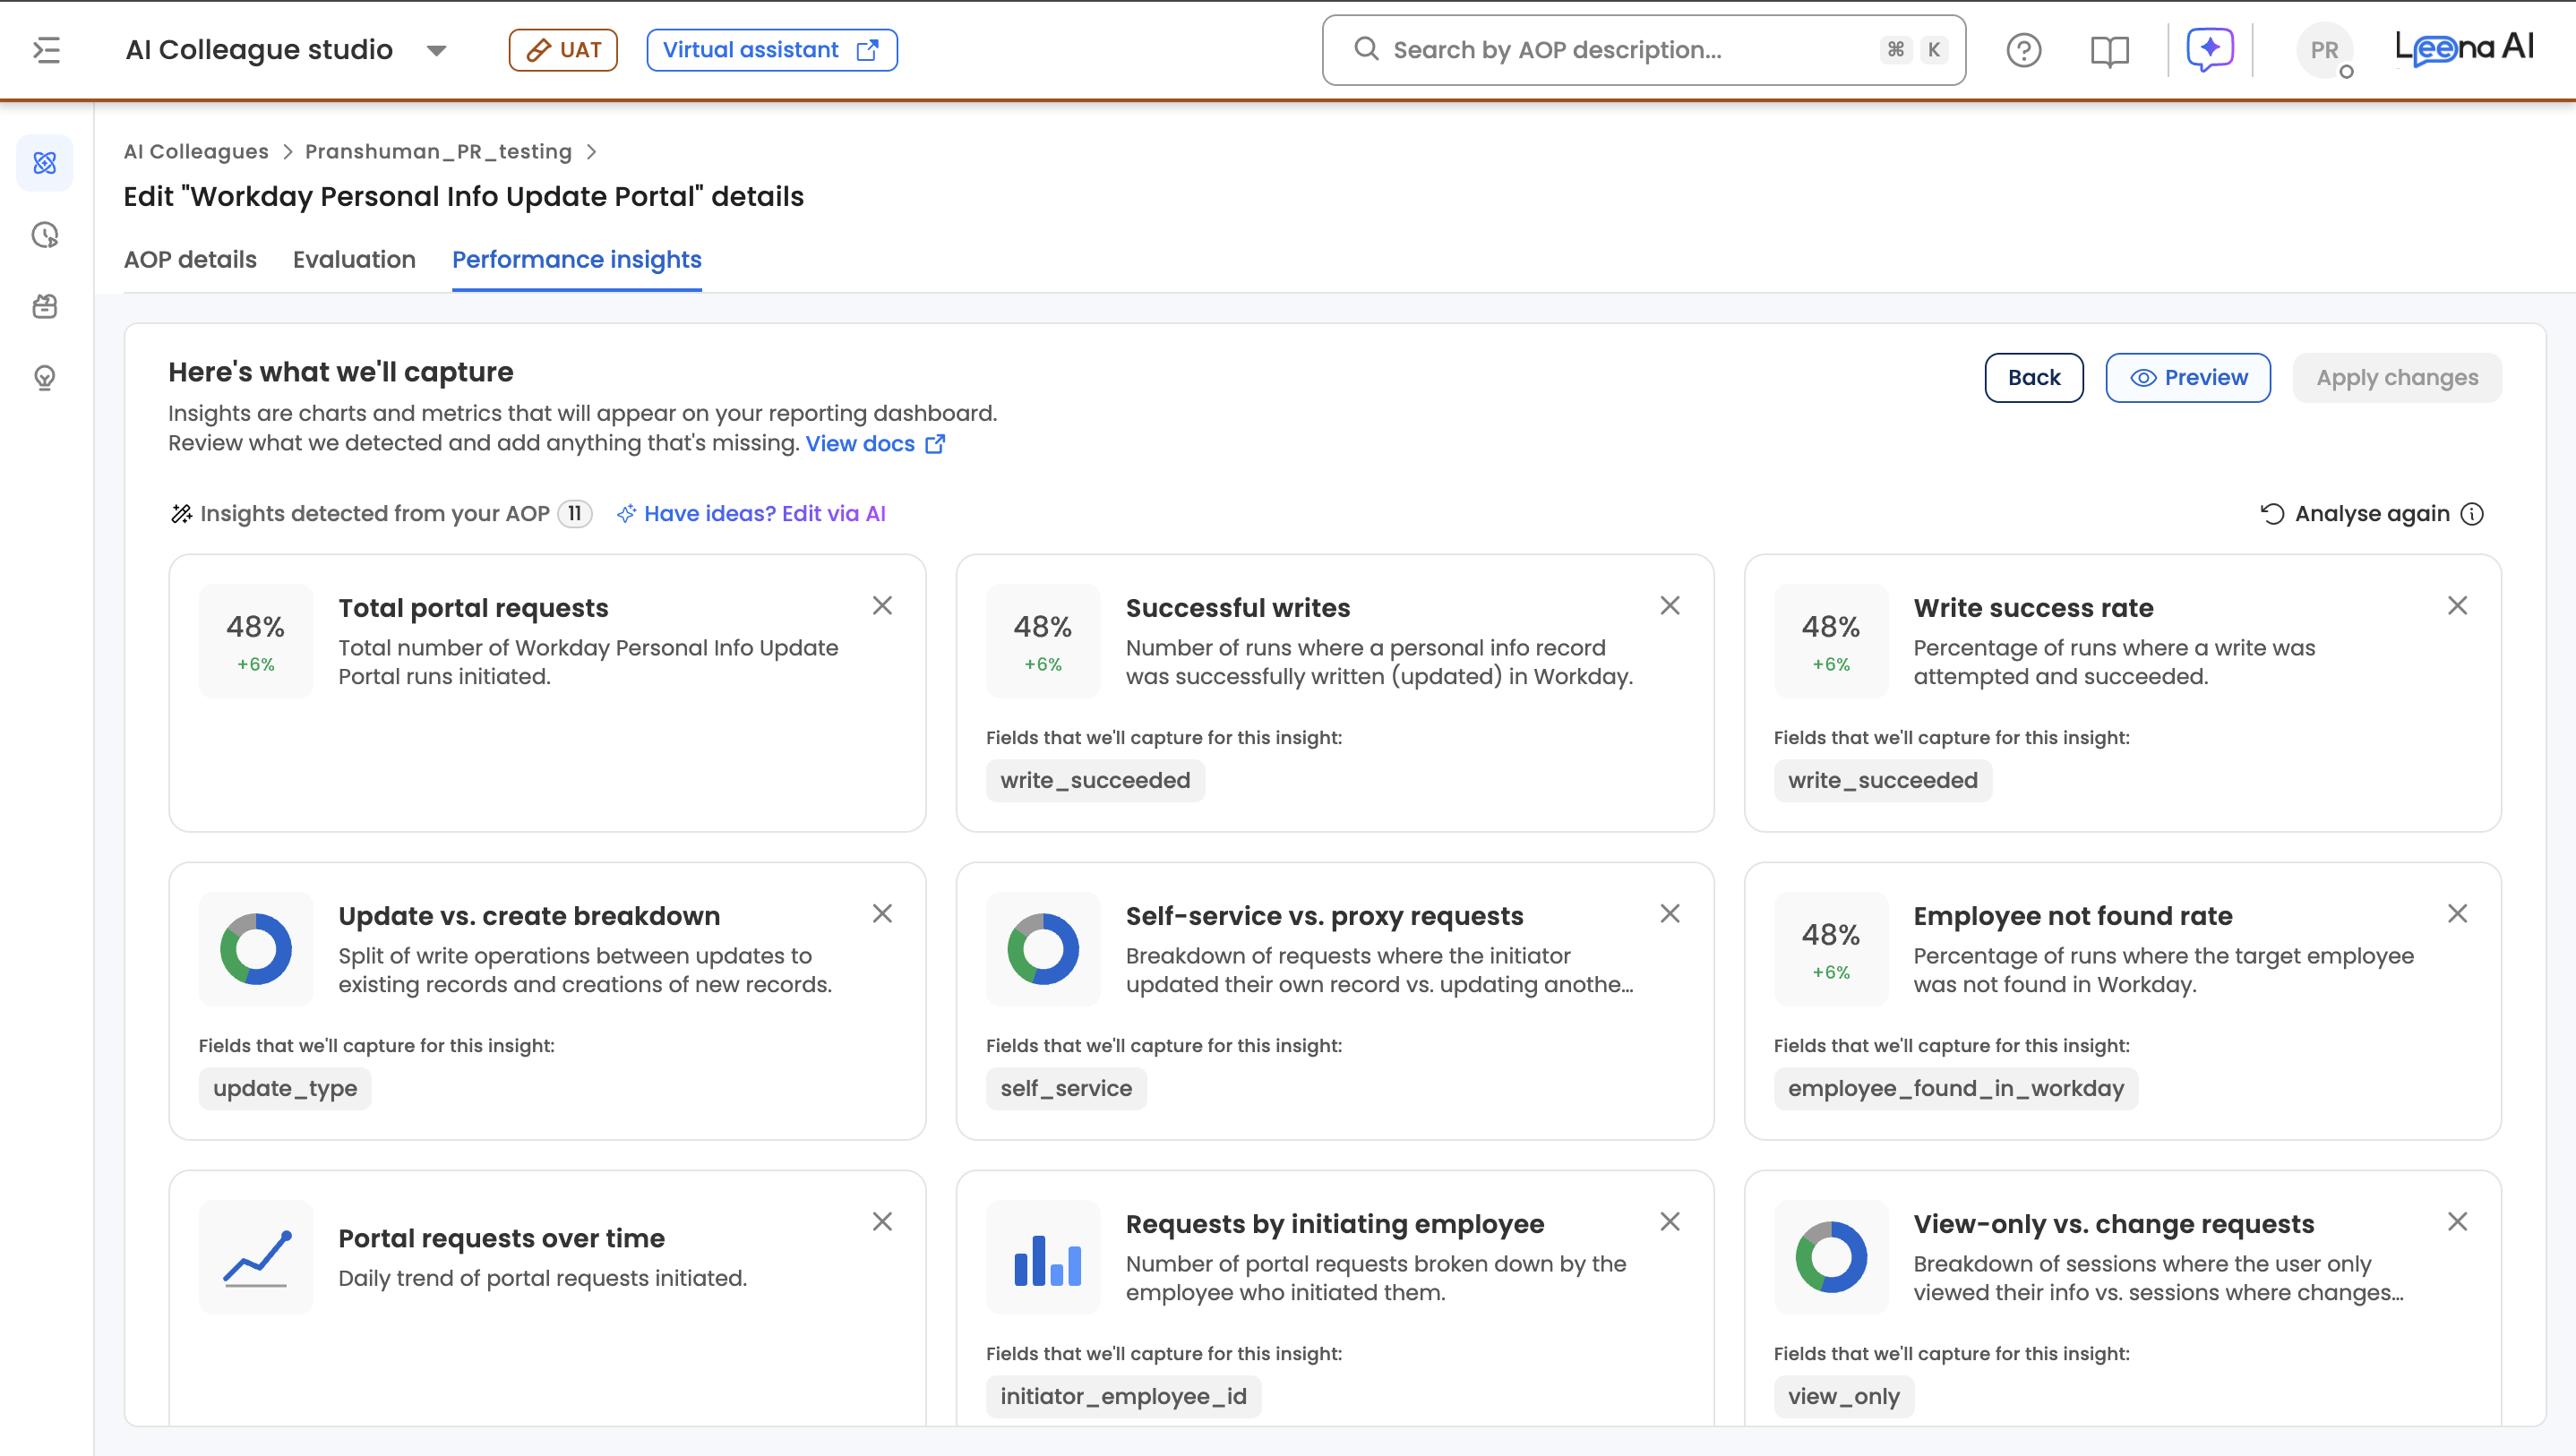
Analysis produces a proposed report you review before anything goes live. On the preview page you can:
- See every proposed insight and the chart it will draw, rendered with sample data so you can judge the shape of each one before real data exists.
- Change an insight's chart type between bar, donut and funnel — these all describe "a value per label," so they're interchangeable. Switching to KPI, trend or table needs a different underlying calculation and is rejected; ask for that as a described change instead (next point).
- Add or change an insight by describing it in plain language — for example, "show me approvals by department," or "make the rejection chart count distinct invoices." The system rewrites the report's configuration to match. If your request is ambiguous, it comes back with a clarifying question rather than guessing.
- Delete an insight you don't want.
- Review the schema — the columns the report will capture.
- Regenerate the whole proposal from fresh evidence if it isn't right.
Note: Nothing is captured or shown until you accept the report.
Step 3 — Accept
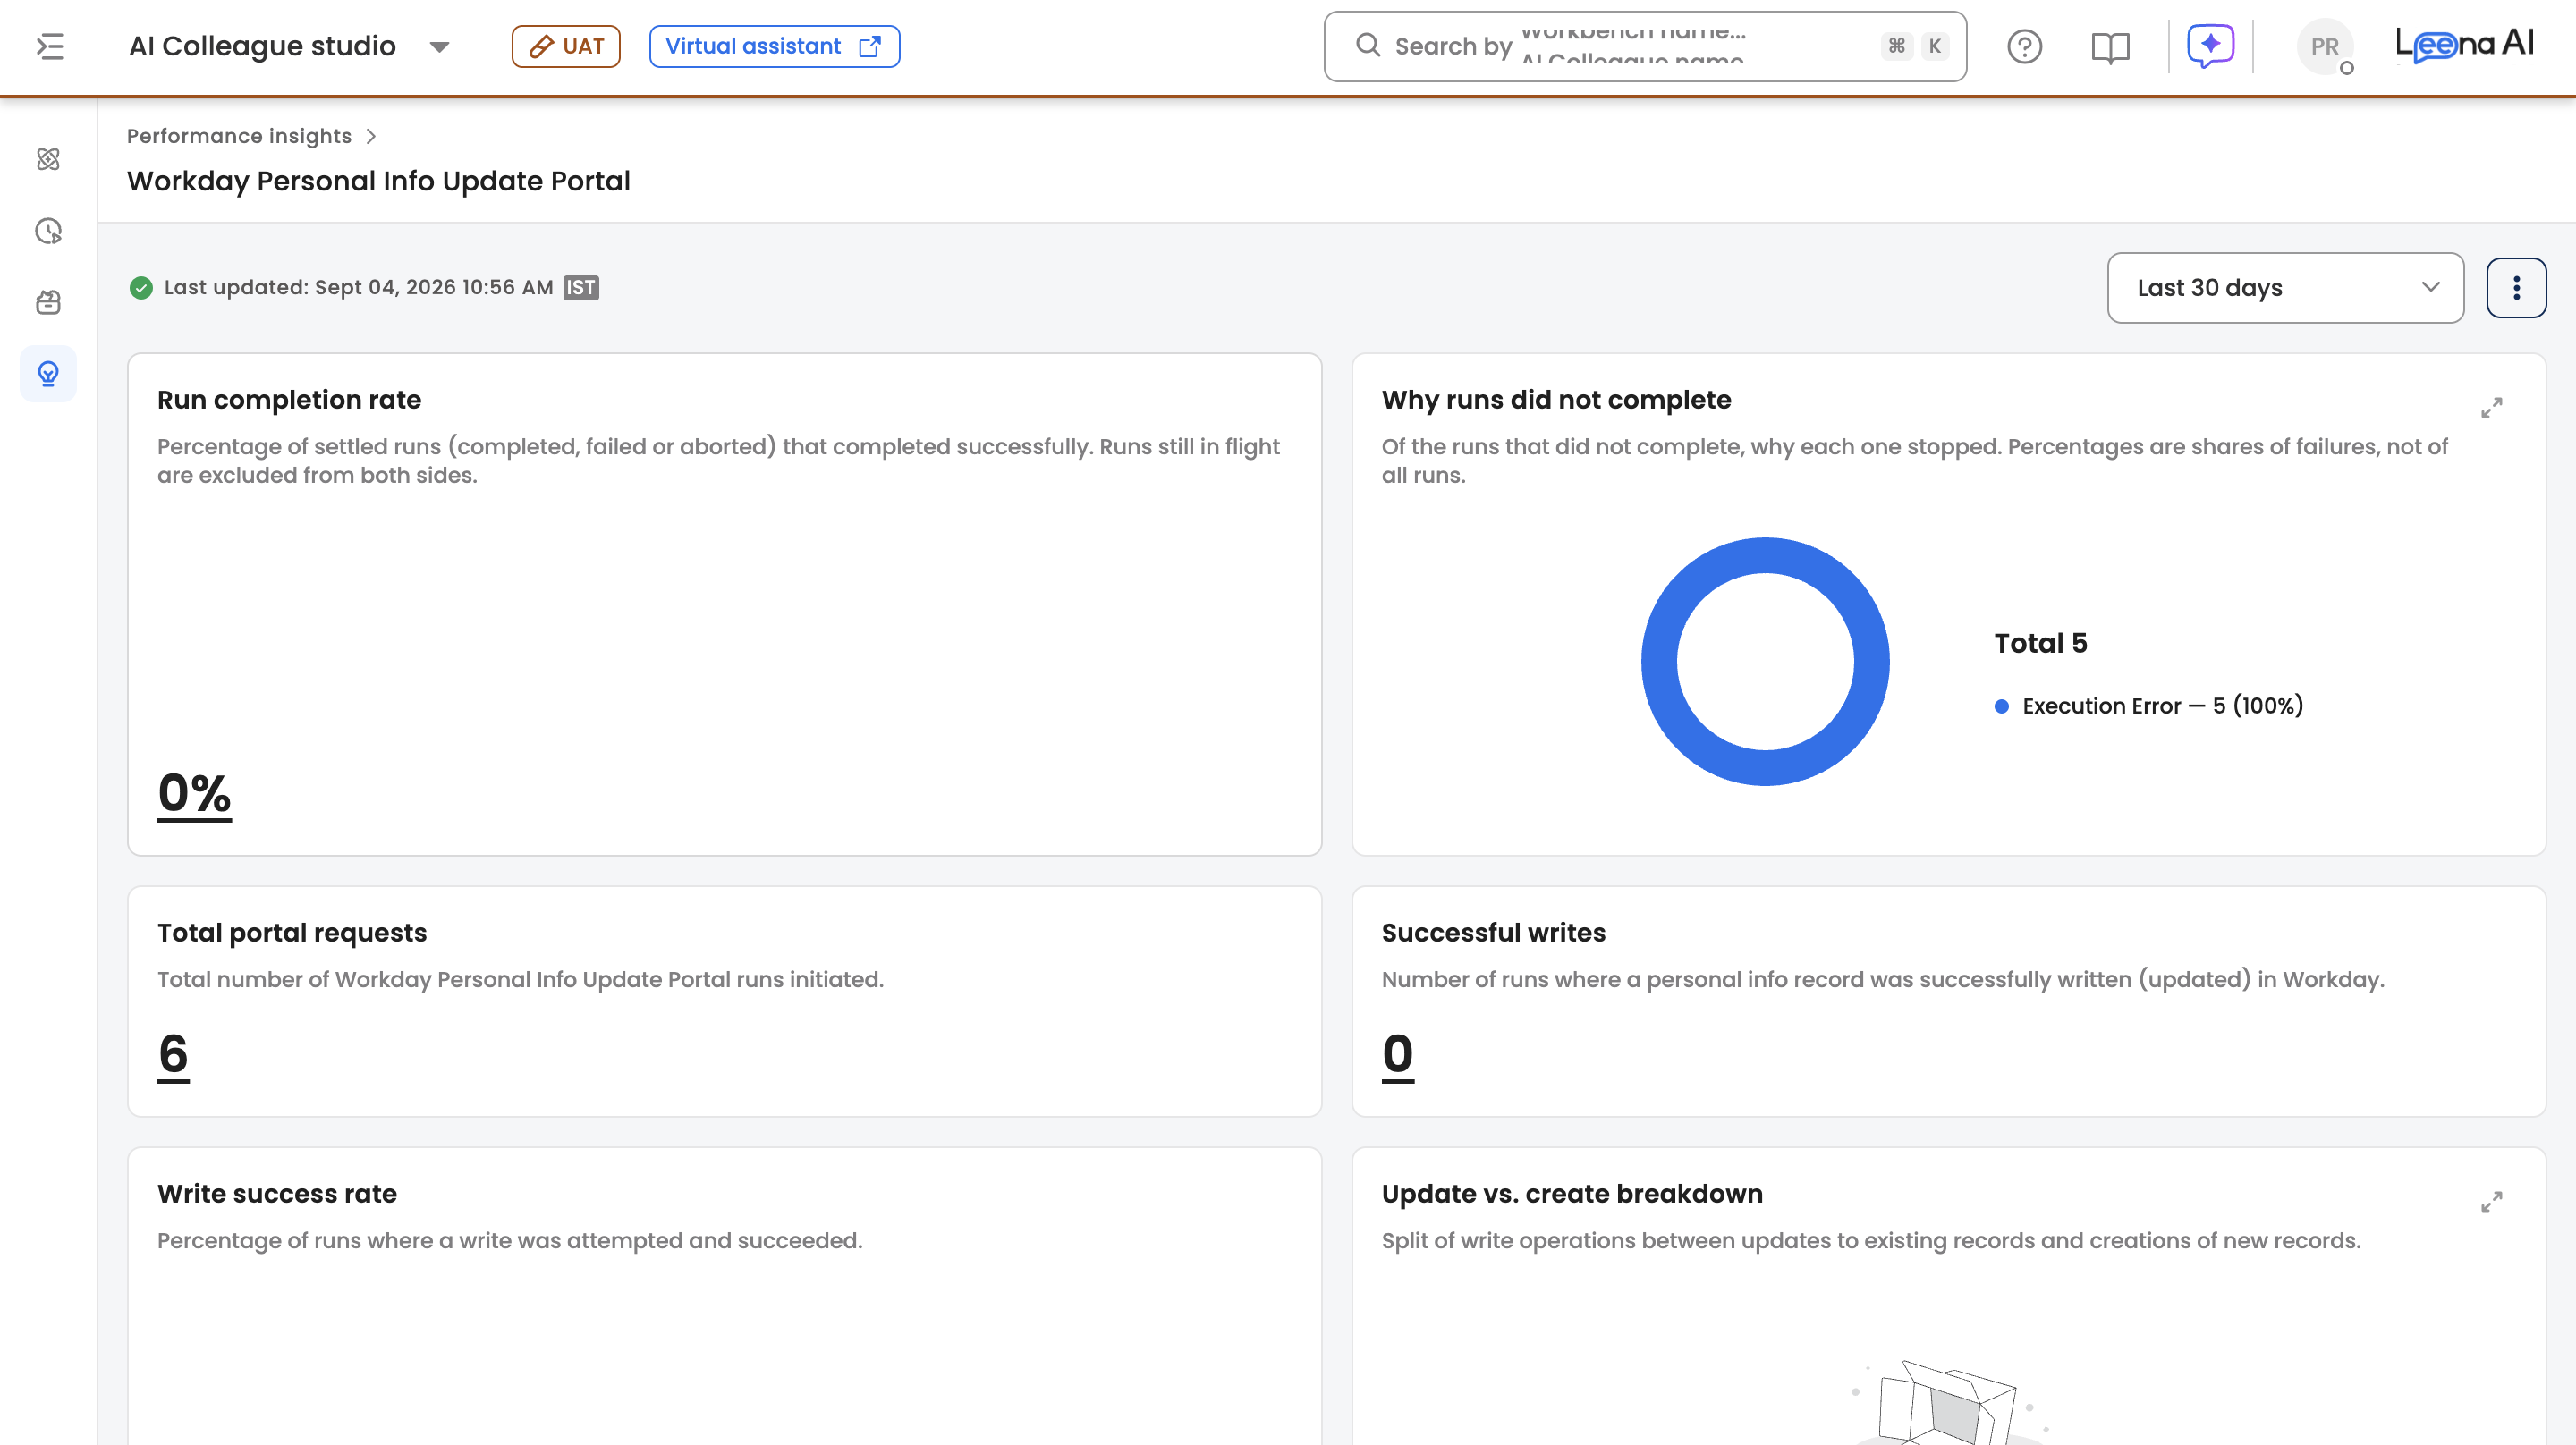
Accept the proposed report. From this point on, every completed run of the AOP is captured and the report begins to fill. The AOP moves into the Live section of the Performance insights screen.
Immediately after accepting, the report exists but has no data — it fills as new runs complete.
2. Read the report
The report lives on the AOP's Insights tab and has a few parts:
- Charts — the insights your report proposed (see chart types below).
- Built-in reliability cards — a completion rate and a failure breakdown, added automatically to every report (see below).
- Rows table — the structured rows captured from runs, so you can see the data behind every chart. Each row carries the AOP run ID it came from.
- Schema — the columns the report is built on.
- Insights Agent — ask a question in plain English (see below).
Chart types
A report is assembled from these visualizations:
| Type | What it shows |
|---|---|
| KPI | A single headline number, optionally with a period-over-period delta. |
| Trend | A value over time, bucketed by day or coarser (or by hour for short ranges). |
| Bar | A value per category. |
| Donut | A value per category, with each slice's share of the total. |
| Funnel | A value per stage, for sequential processes. |
| Table | The captured rows themselves. |
Percentages are reported on a 0–100 scale — a 75% rate reads as 75, not 0.75.
Built-in reliability cards
Every report carries two cards that Performance Insights adds automatically, whether or not the analysis thought to propose them. Reliability is usually the first thing anyone judges an automation on, and these make it mean exactly the same thing on every AOP:
- Run completion rate — the percentage of settled runs that completed successfully. A run is settled once it can no longer change on its own (completed, failed or aborted); runs still in flight (in progress or paused) are excluded from both sides of the calculation, so the number doesn't sag simply because work is still running. The report header shows the settled and in-flight counts separately, so the percentage is always reconcilable.
- Why runs didn't complete — of the runs that did not complete, why each one stopped, broken down across the reasons a run can stop: user abandoned, user aborted, execution error, guardrail violation, timeout, AOP aborted, AOP failed, and cause unknown. A run that stopped without a reason recorded shows as unattributed. Percentages here are shares of failures, not of all runs — the share of all runs is the completion-rate card's job.
Because these two cards must mean the same thing everywhere, they can't be edited, renamed or deleted. They're computed at read time rather than stored, so they're unaffected by report versions, rebuilds and back-fill.
Filtering by date range
Every read on the report is scoped to a date range: last 7 days, 30 days, 90 days, or all time. The default is 30 days.
Drilling into a chart
Any chart can be opened to see the rows behind it — the paginated population that produced that number, sortable and filterable. This is how you get from "8.3% payment failure rate" to the specific runs that failed. The failure breakdown drills down the same way, so a bucket like Execution Error opens the runs that stopped for that reason.
Note: Filters are only available on columns the schema marks as filterable. A filter on any other column is ignored rather than rejected, so use the filter controls the report offers rather than constructing filters by hand.
Viewing an earlier version
A report keeps its history. When a substantial AOP change creates a new report version, the previous version is frozen and stays viewable, read-only, under the schema it had at the time. Use the version switcher to move between the live version and any frozen one; all charts, rows and exports reload for the version you pick. Most reports have exactly one version — see Managing reports.
3. What gets captured
The report fills on its own as runs happen — you don't trigger or schedule capture. A few things are worth knowing about what lands in it:
- One run can produce two kinds of row — a run row (facts about the run as a whole, e.g. "this daily digest covered 2 Aug") and entity rows (one per business thing the run touched, e.g. "invoice INV-1003 ended up paid").
- Eval runs are never captured. Only real runs ever become report data.
- Helpers roll up. A helper AOP's data is captured into its parent's report, so nothing is double-counted.
- Failed and aborted runs are captured too — that's what powers the built-in reliability cards.
Note: Capture cost scales with the number of runs, not with how many things each run handles, so reporting stays affordable even for AOPs that process large batches.
Updated about 2 months ago