
AI Colleagues
AI Colleagues Analytics
The AI Colleagues dashboard gives Admins a run-level view of everything their AI Colleagues are doing — how many runs are being executed, how many employees are participating, how runs are being resolved, which AI Colleagues, AOPs, and Tools are doing the most work, and how many tokens all of this is consuming.
Navigate to Analytics → Bot Platform → AI Colleagues to open the dashboard.
AvailabilityThe AI Colleagues dashboard appears in the Bot Platform analytics menu only for bots where AI Colleagues is enabled. If you don't see it, reach out to your Leena AI representative.
Working with the dashboard
Time range. Use the selector at the top right to switch between Today, Last 7 days, Last 30 days (default), Till now, or a Custom range. Every panel on the page recalculates for the selected window. Runs are bucketed by the time they were initiated.
Last updated. The timestamp under the page title shows when run data was last synced into analytics, along with the timezone applied to all charts and tables.
Filters. Click the filter icon to narrow every panel on the page at once. Filters can be combined.
| Filter | Options |
|---|---|
| Handled by | One or more AI Colleagues (or the Master Orchestrator) that processed the run |
| AOP | One or more AOPs executed during the run |
| Tools | One or more Tools executed during the run |
| Initiated by | The employee who triggered the run |
| Status | Handled, Unhandled, In progress, Cancelled |
| Escalation | Yes / No |
| Trigger type | Manual, Workbench, API |
| Schedule name | The schedule that triggered the run (for Workbench runs) |
| Guardrail violation | PII Detection, Moderation, Jailbreak |
Export. A dashboard-level export is available from the 3-dot menu at the top of the page. Individual panels also support CSV, PNG, and PDF downloads from their own menus, and every drilldown table can be exported to CSV.
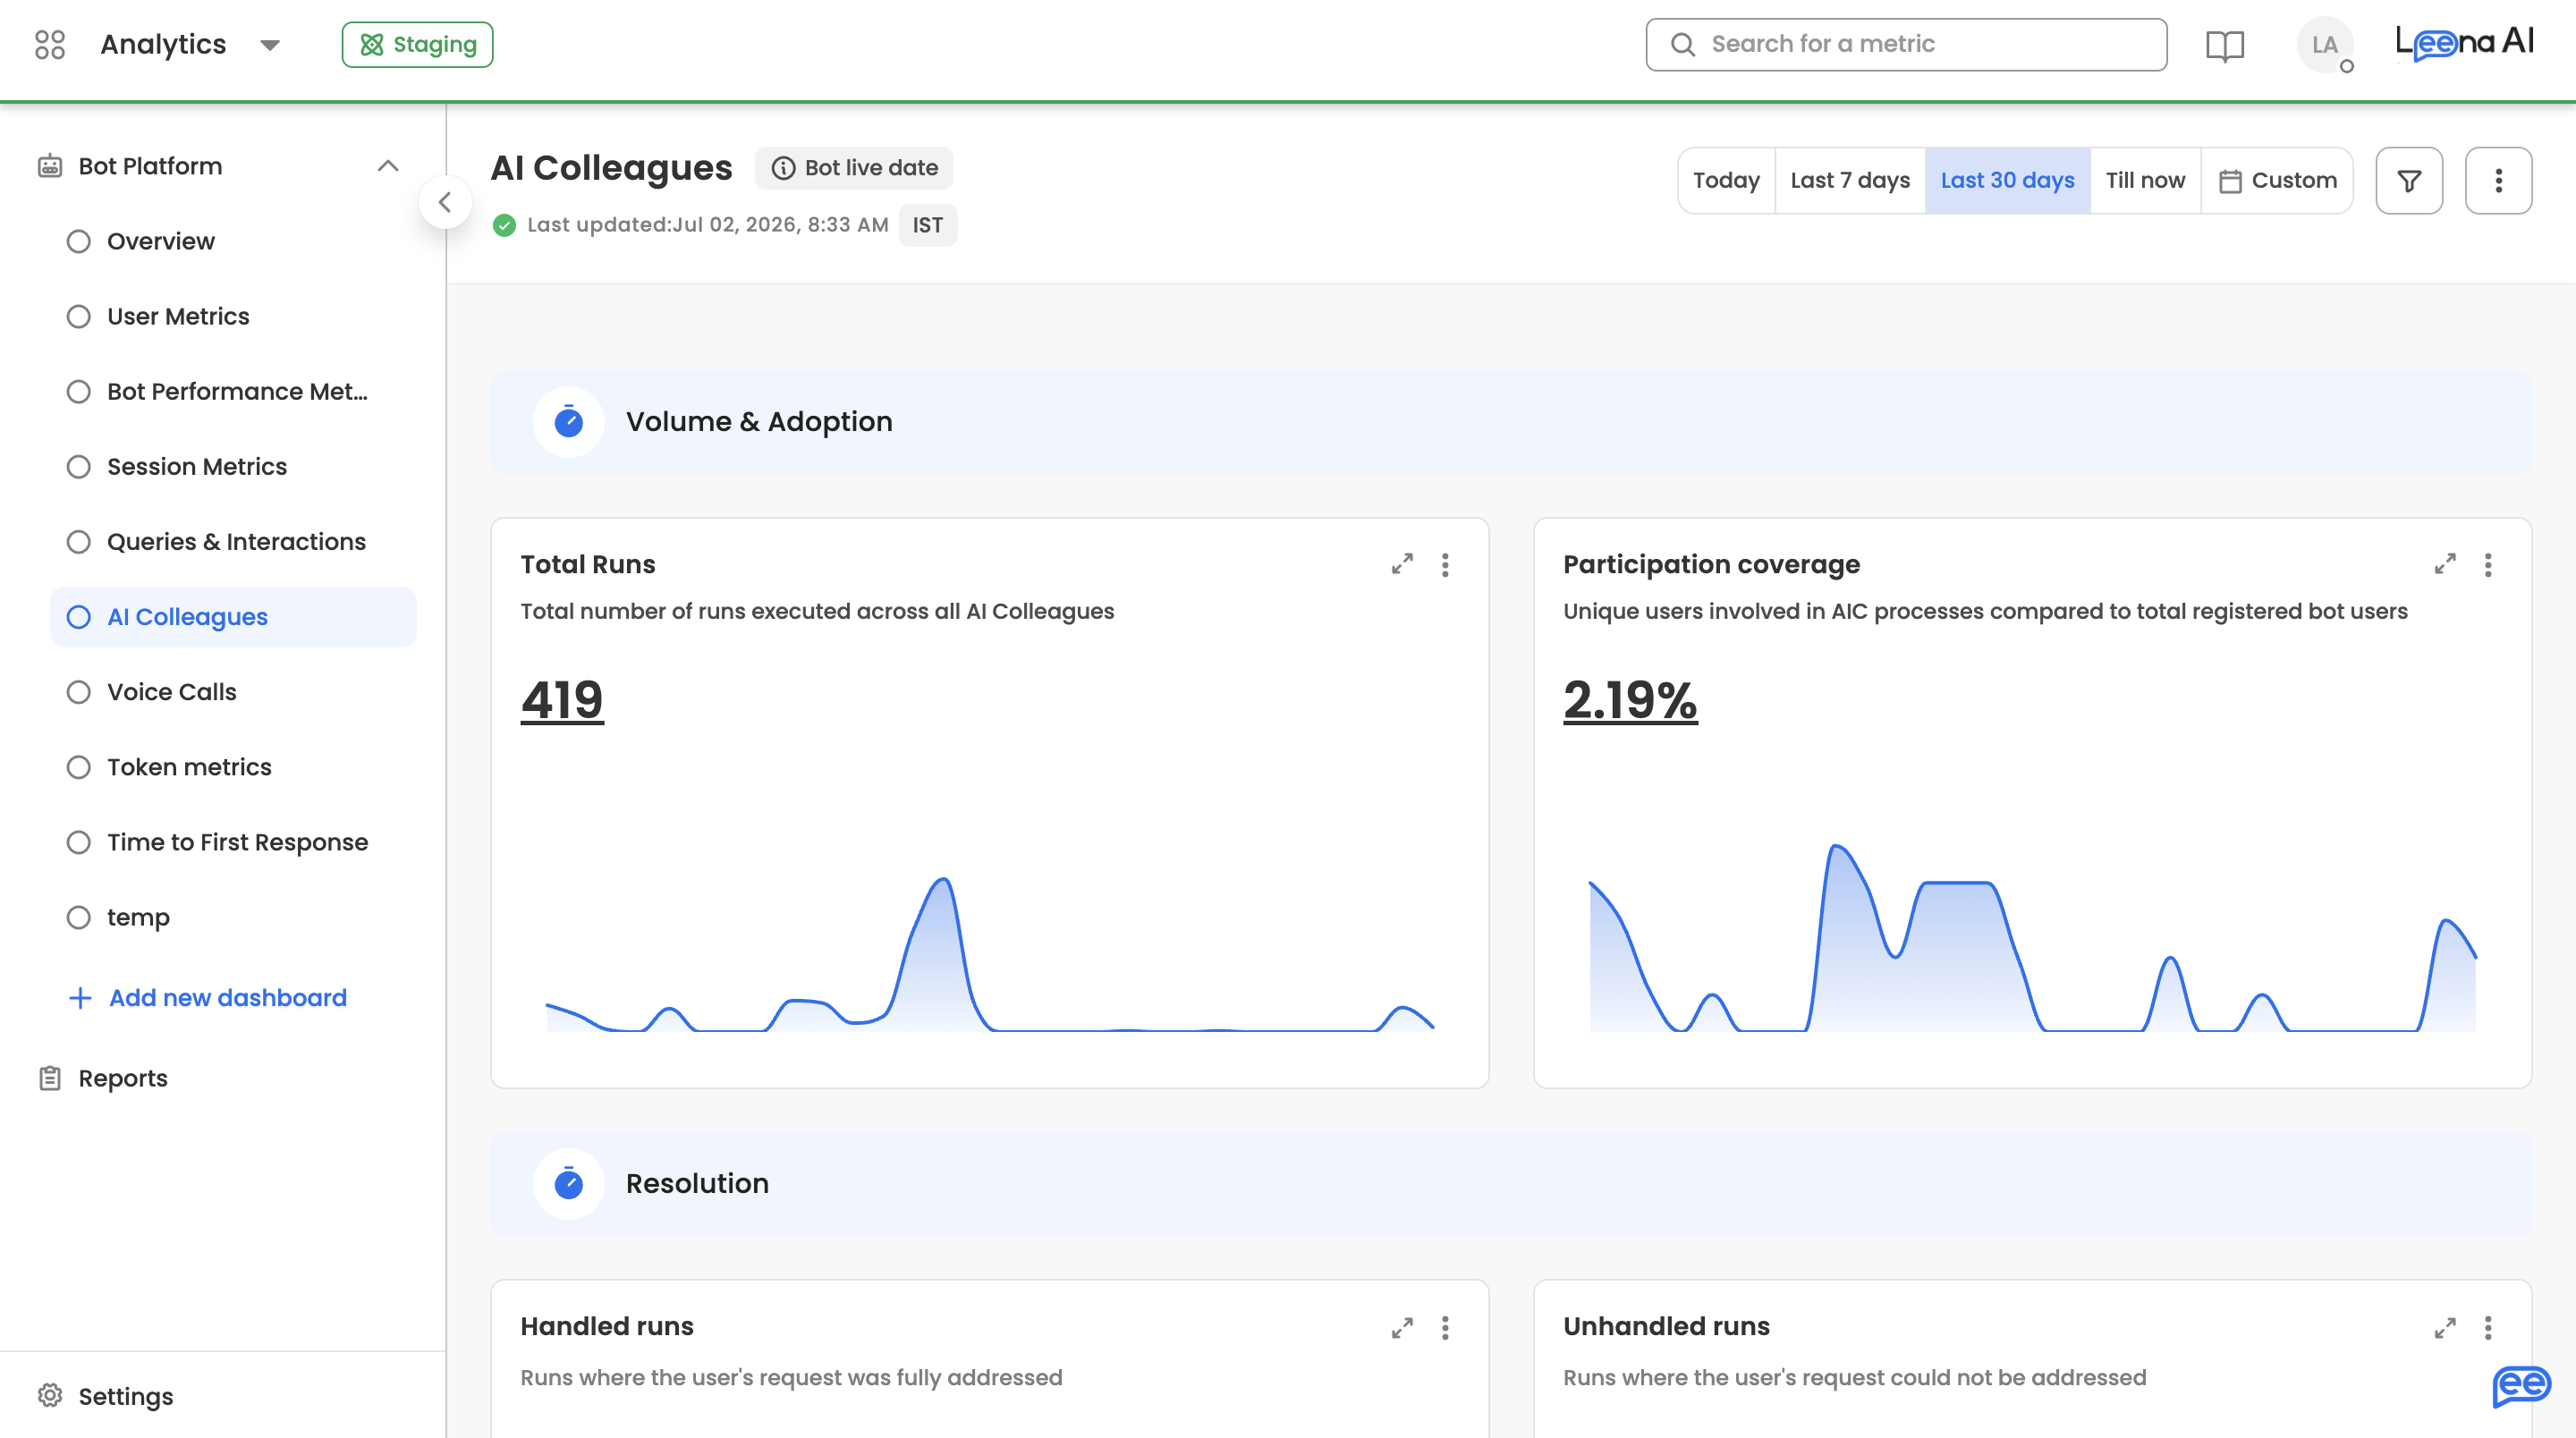
Volume & Adoption
This section answers two questions: how much work are your AI Colleagues doing, and how much of your workforce is involved.
Total Runs
Total number of runs executed across all AI Colleagues in the selected period, with a trend line showing how volume is distributed over time. A run is counted once, regardless of how many AOPs or Tools it touched.
Click the value to open the run-level drilldown, where you can switch between All, Successful, and Failed runs.
Participation coverage
Unique users involved in AI Colleague processes compared to total registered bot users, shown as a percentage with a trend line.
How participation coverage is calculatedThe numerator counts every unique employee who appeared in a run in any capacity — as the initiator, a task assignee, an escalation manager, or a notification recipient. The denominator counts all unique, non-terminated employees with access to the bot. Both sides are de-duplicated by email, so an employee who participates in many runs is counted once.
Resolution
This section breaks total runs down by how they ended. Each panel is a gauge showing its count as a share of total runs, and each opens a run-level drilldown on click.
| Panel | What it counts |
|---|---|
| Handled runs | Runs where the user's request was fully addressed |
| Unhandled runs | Runs where the user's request could not be addressed |
| In progress runs | Runs where the user's request is still in progress |
| Cancelled runs | Runs stopped by the user via cancel action or clear chat |
| Escalation rate | Runs handed off to a human agent |
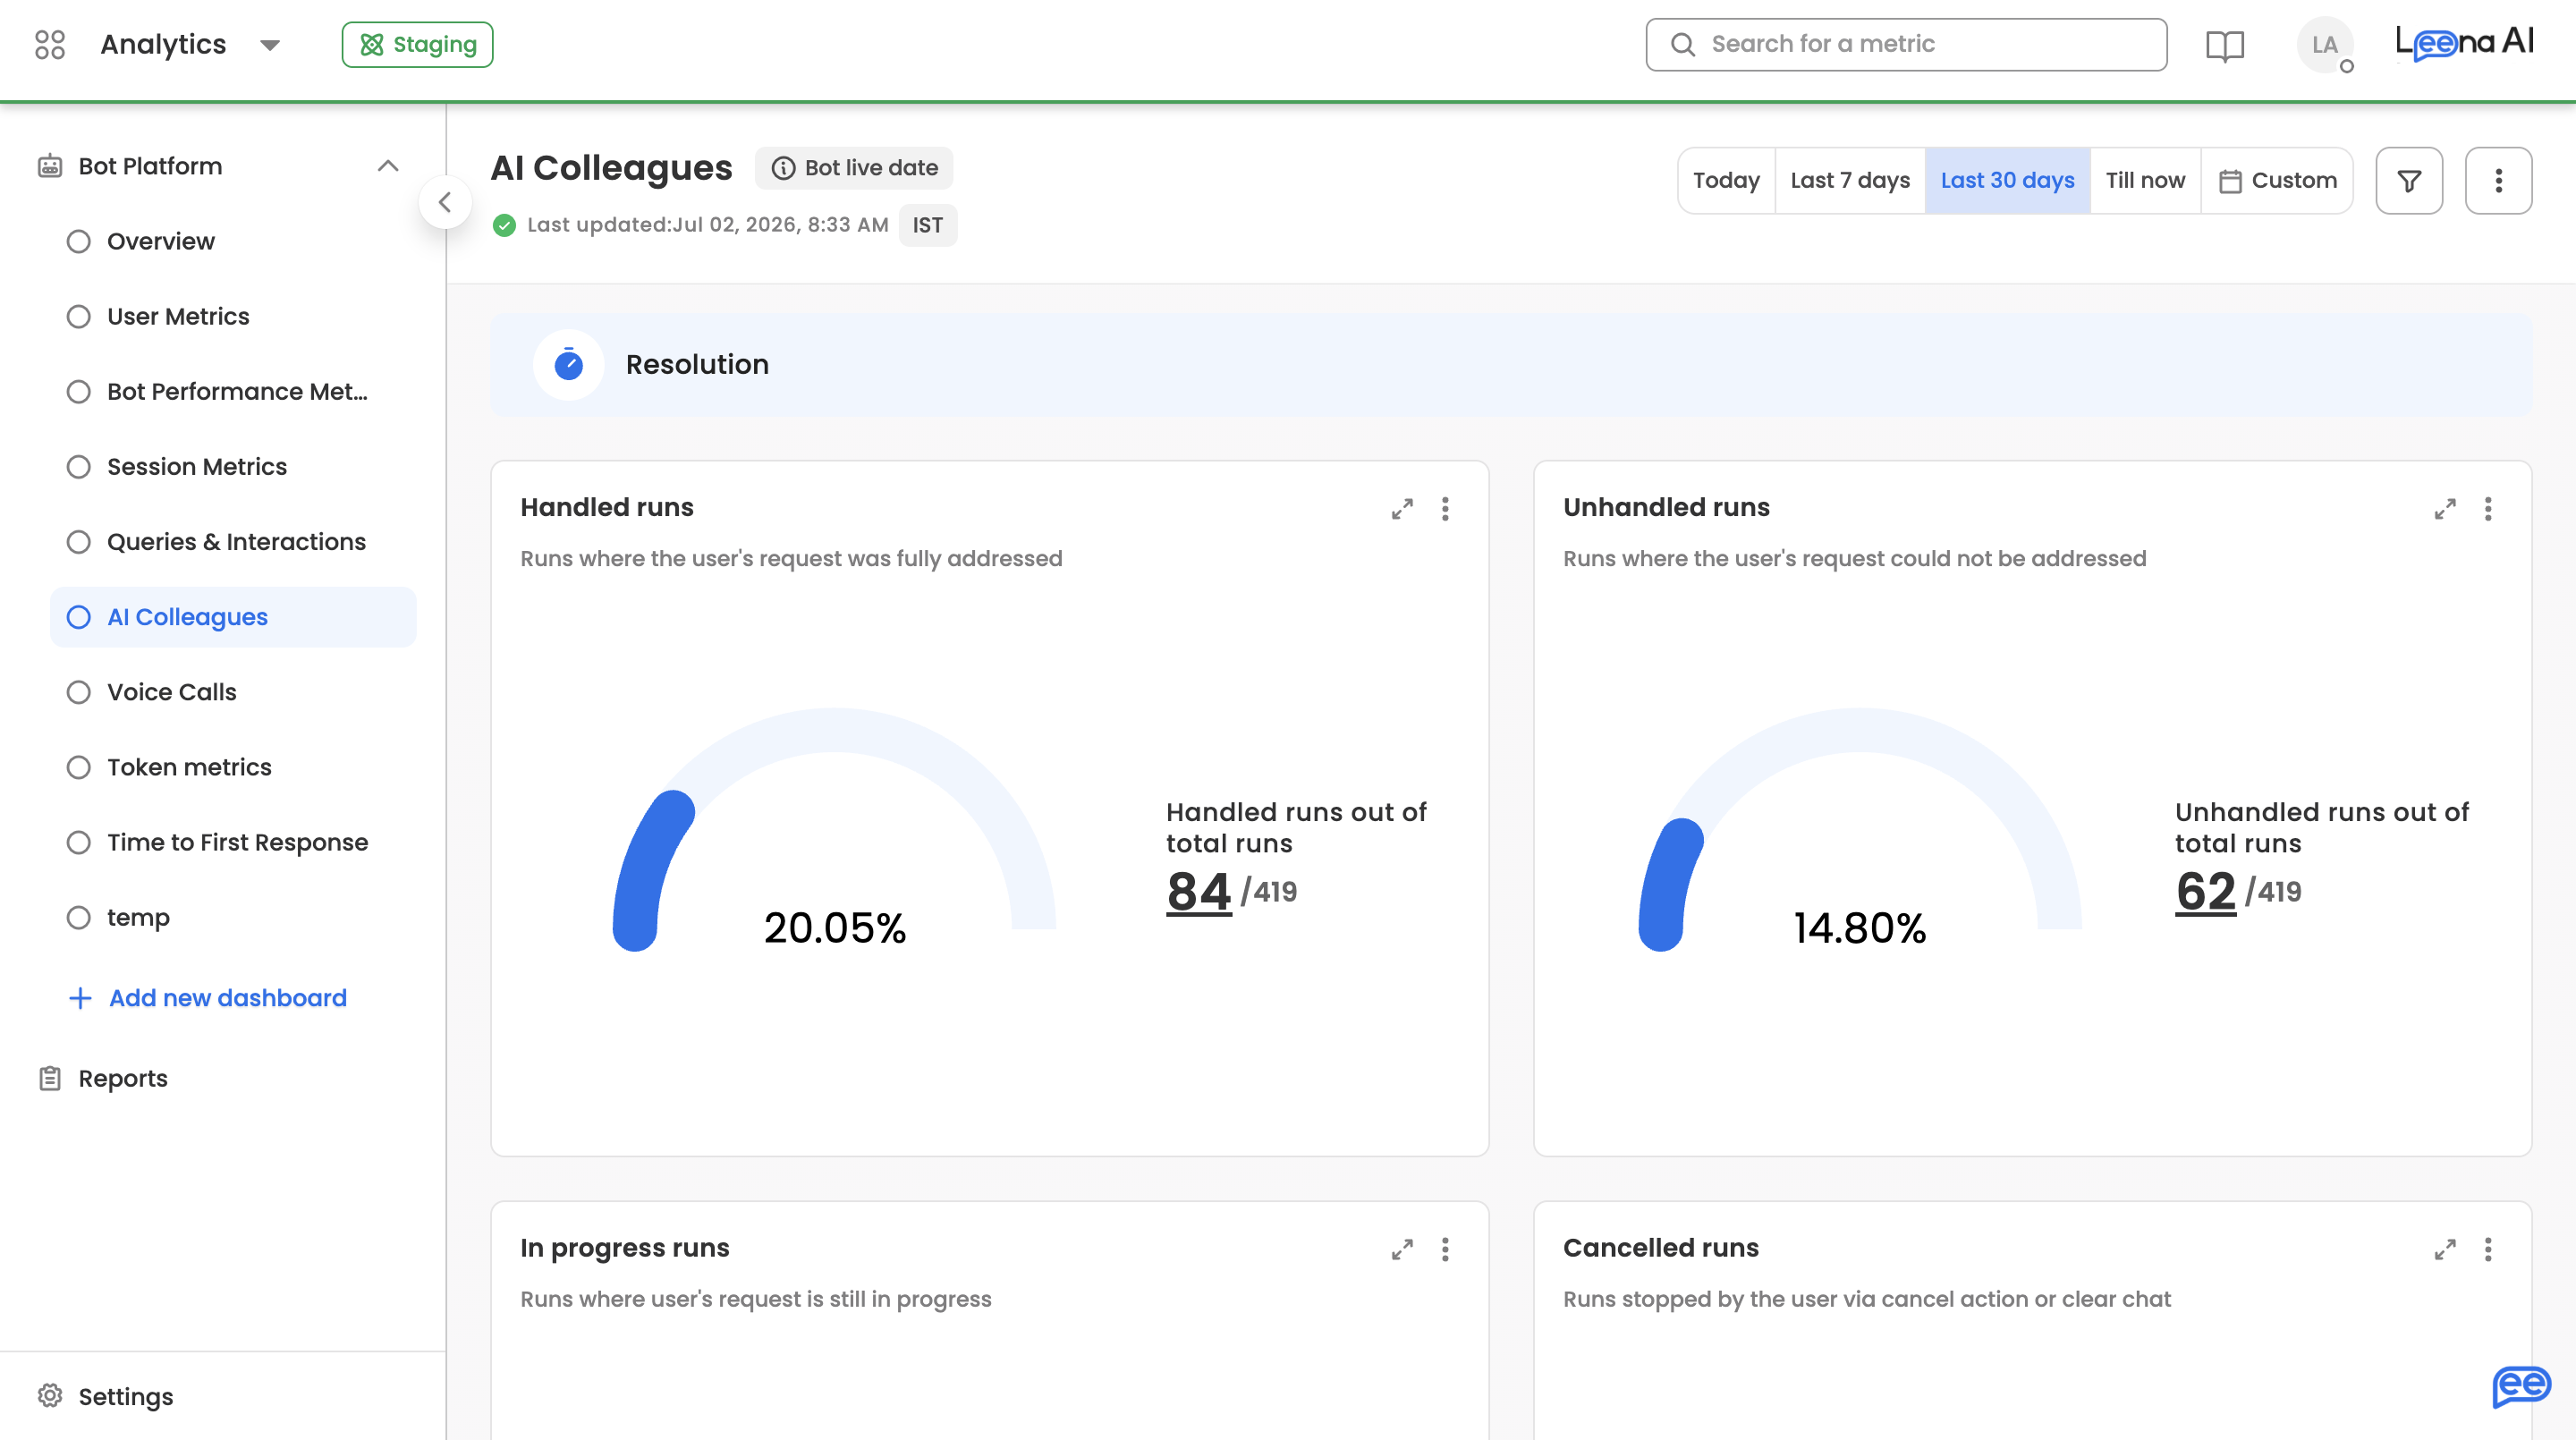
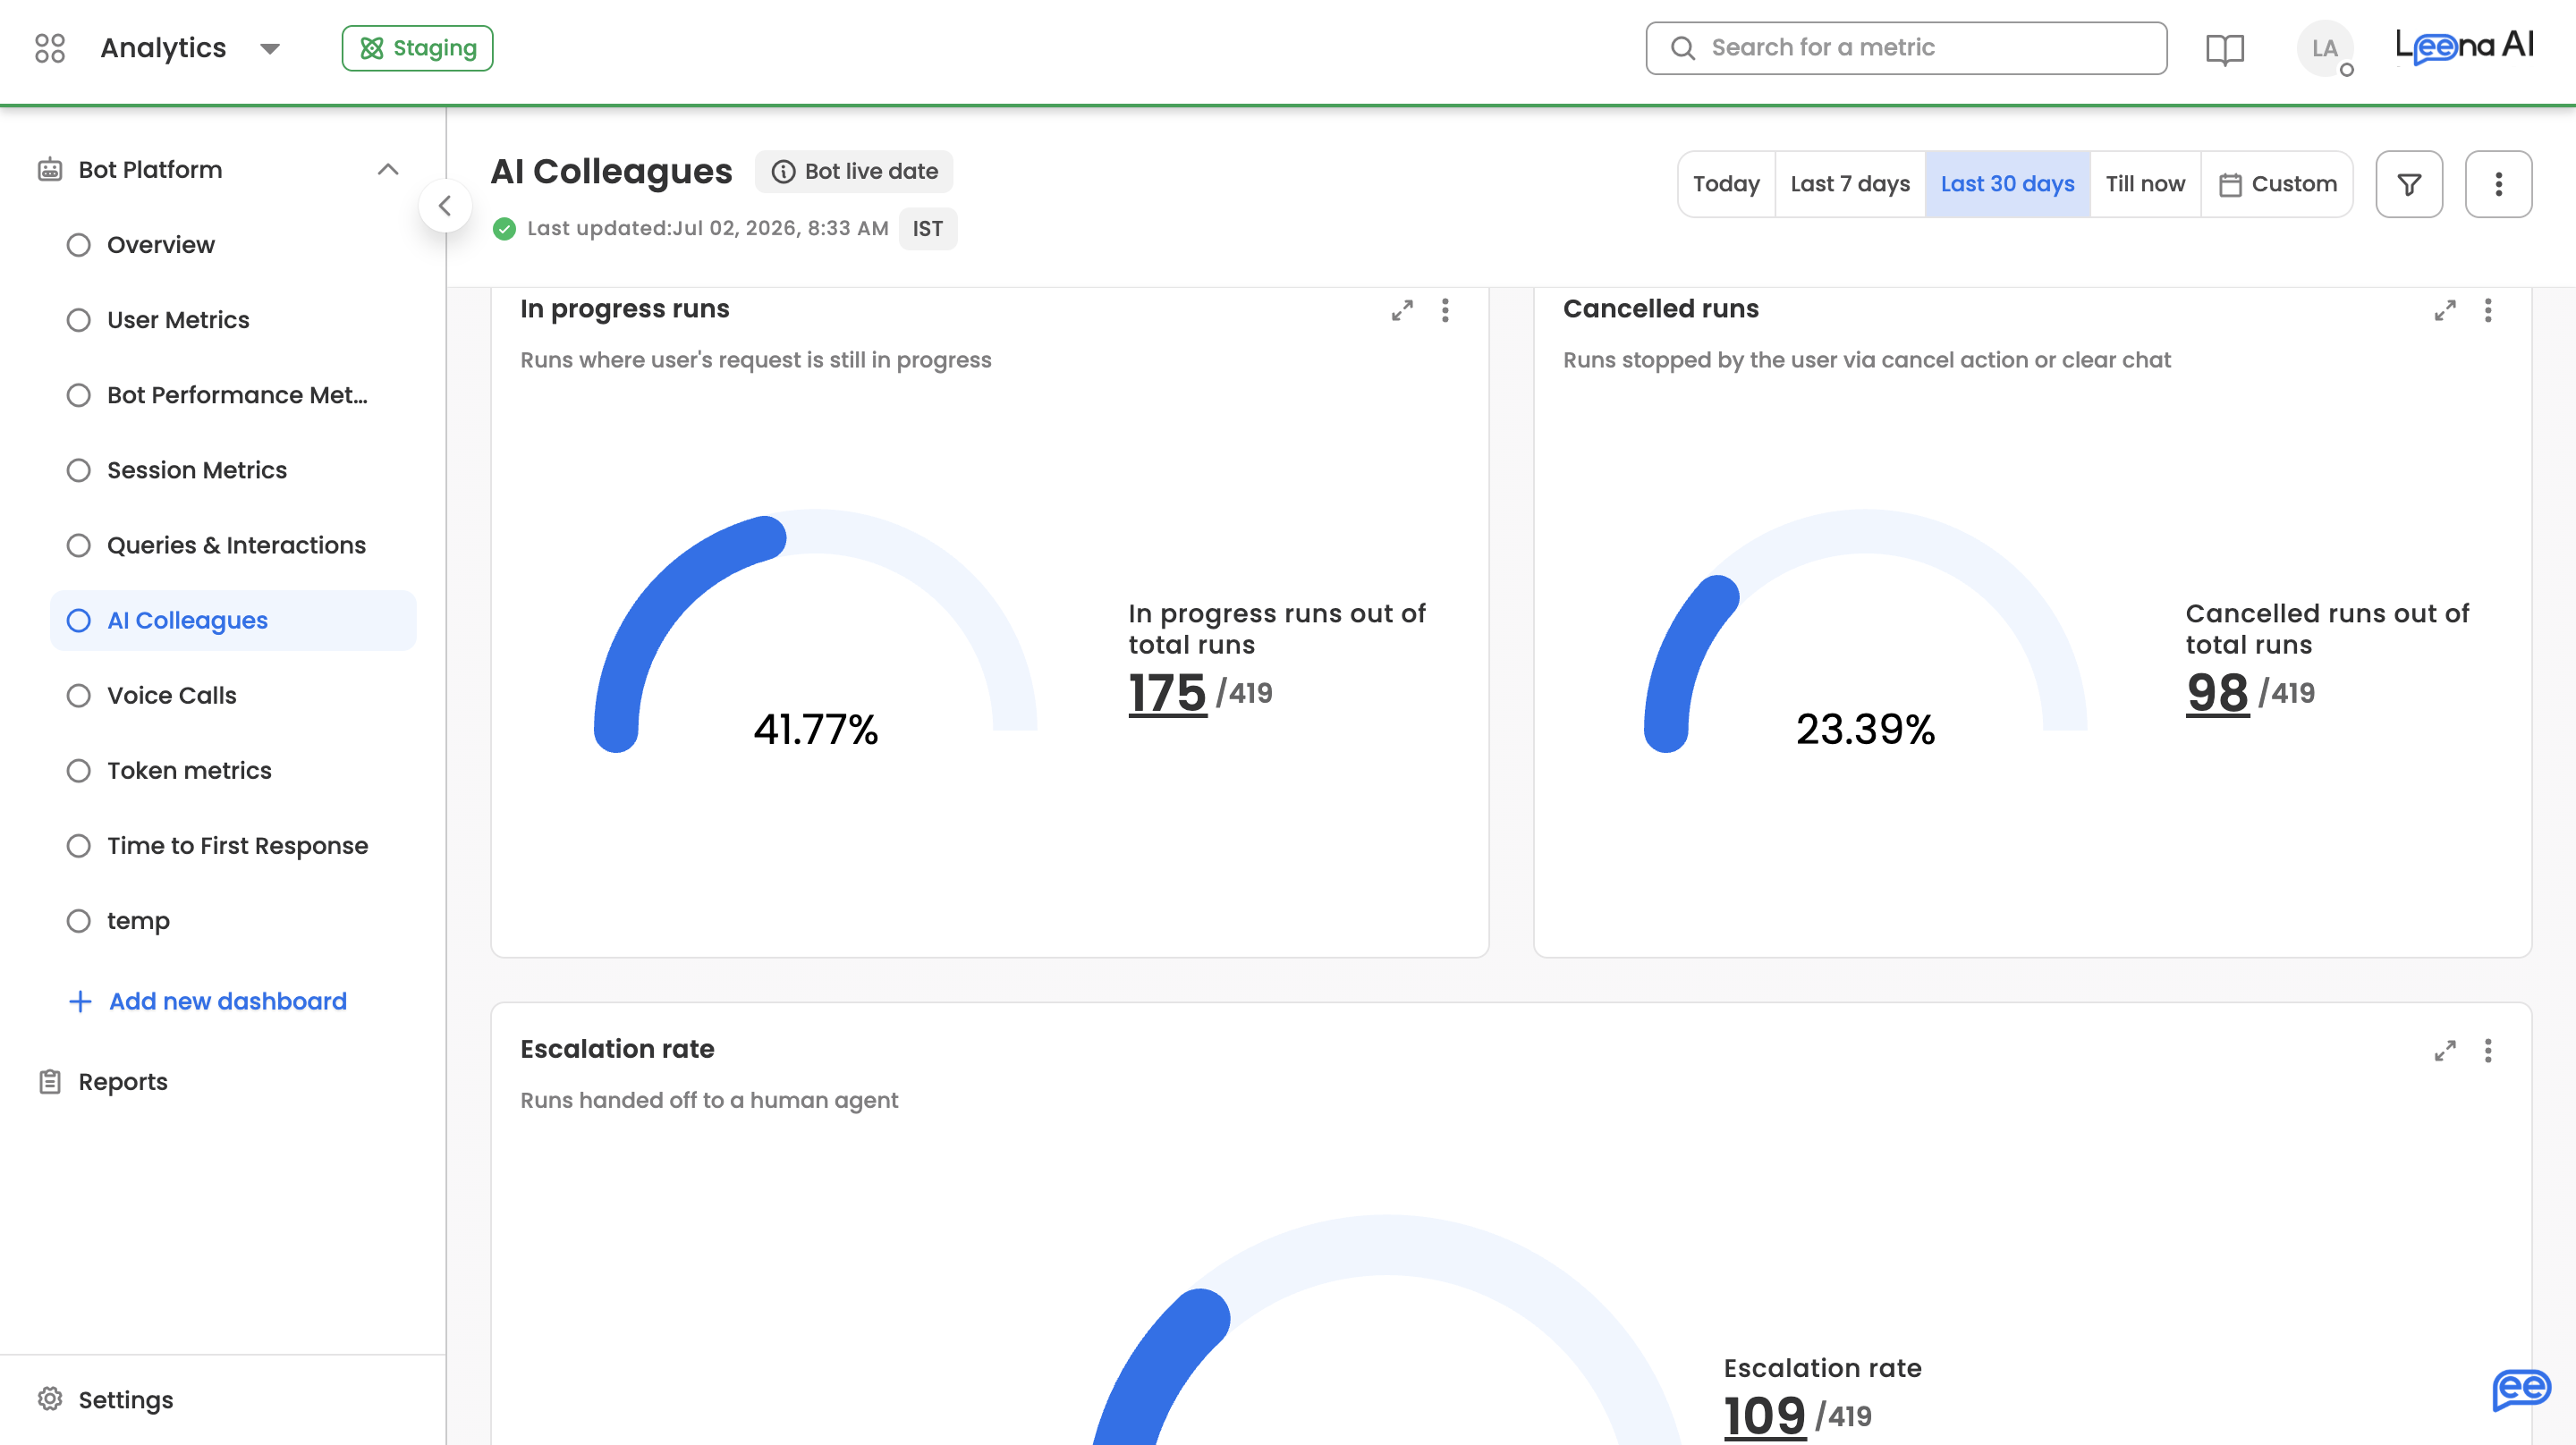
Run statuses vs. escalationEvery run has exactly one status — Handled, Unhandled, In progress, or Cancelled — so the four status gauges together account for all runs. Escalation is tracked separately: a run is flagged as escalated if it required intervention from an escalation contact, whatever its final status. For unhandled runs, the drilldown includes the Unhandled due to category and a View reason action explaining why the run could not be completed.
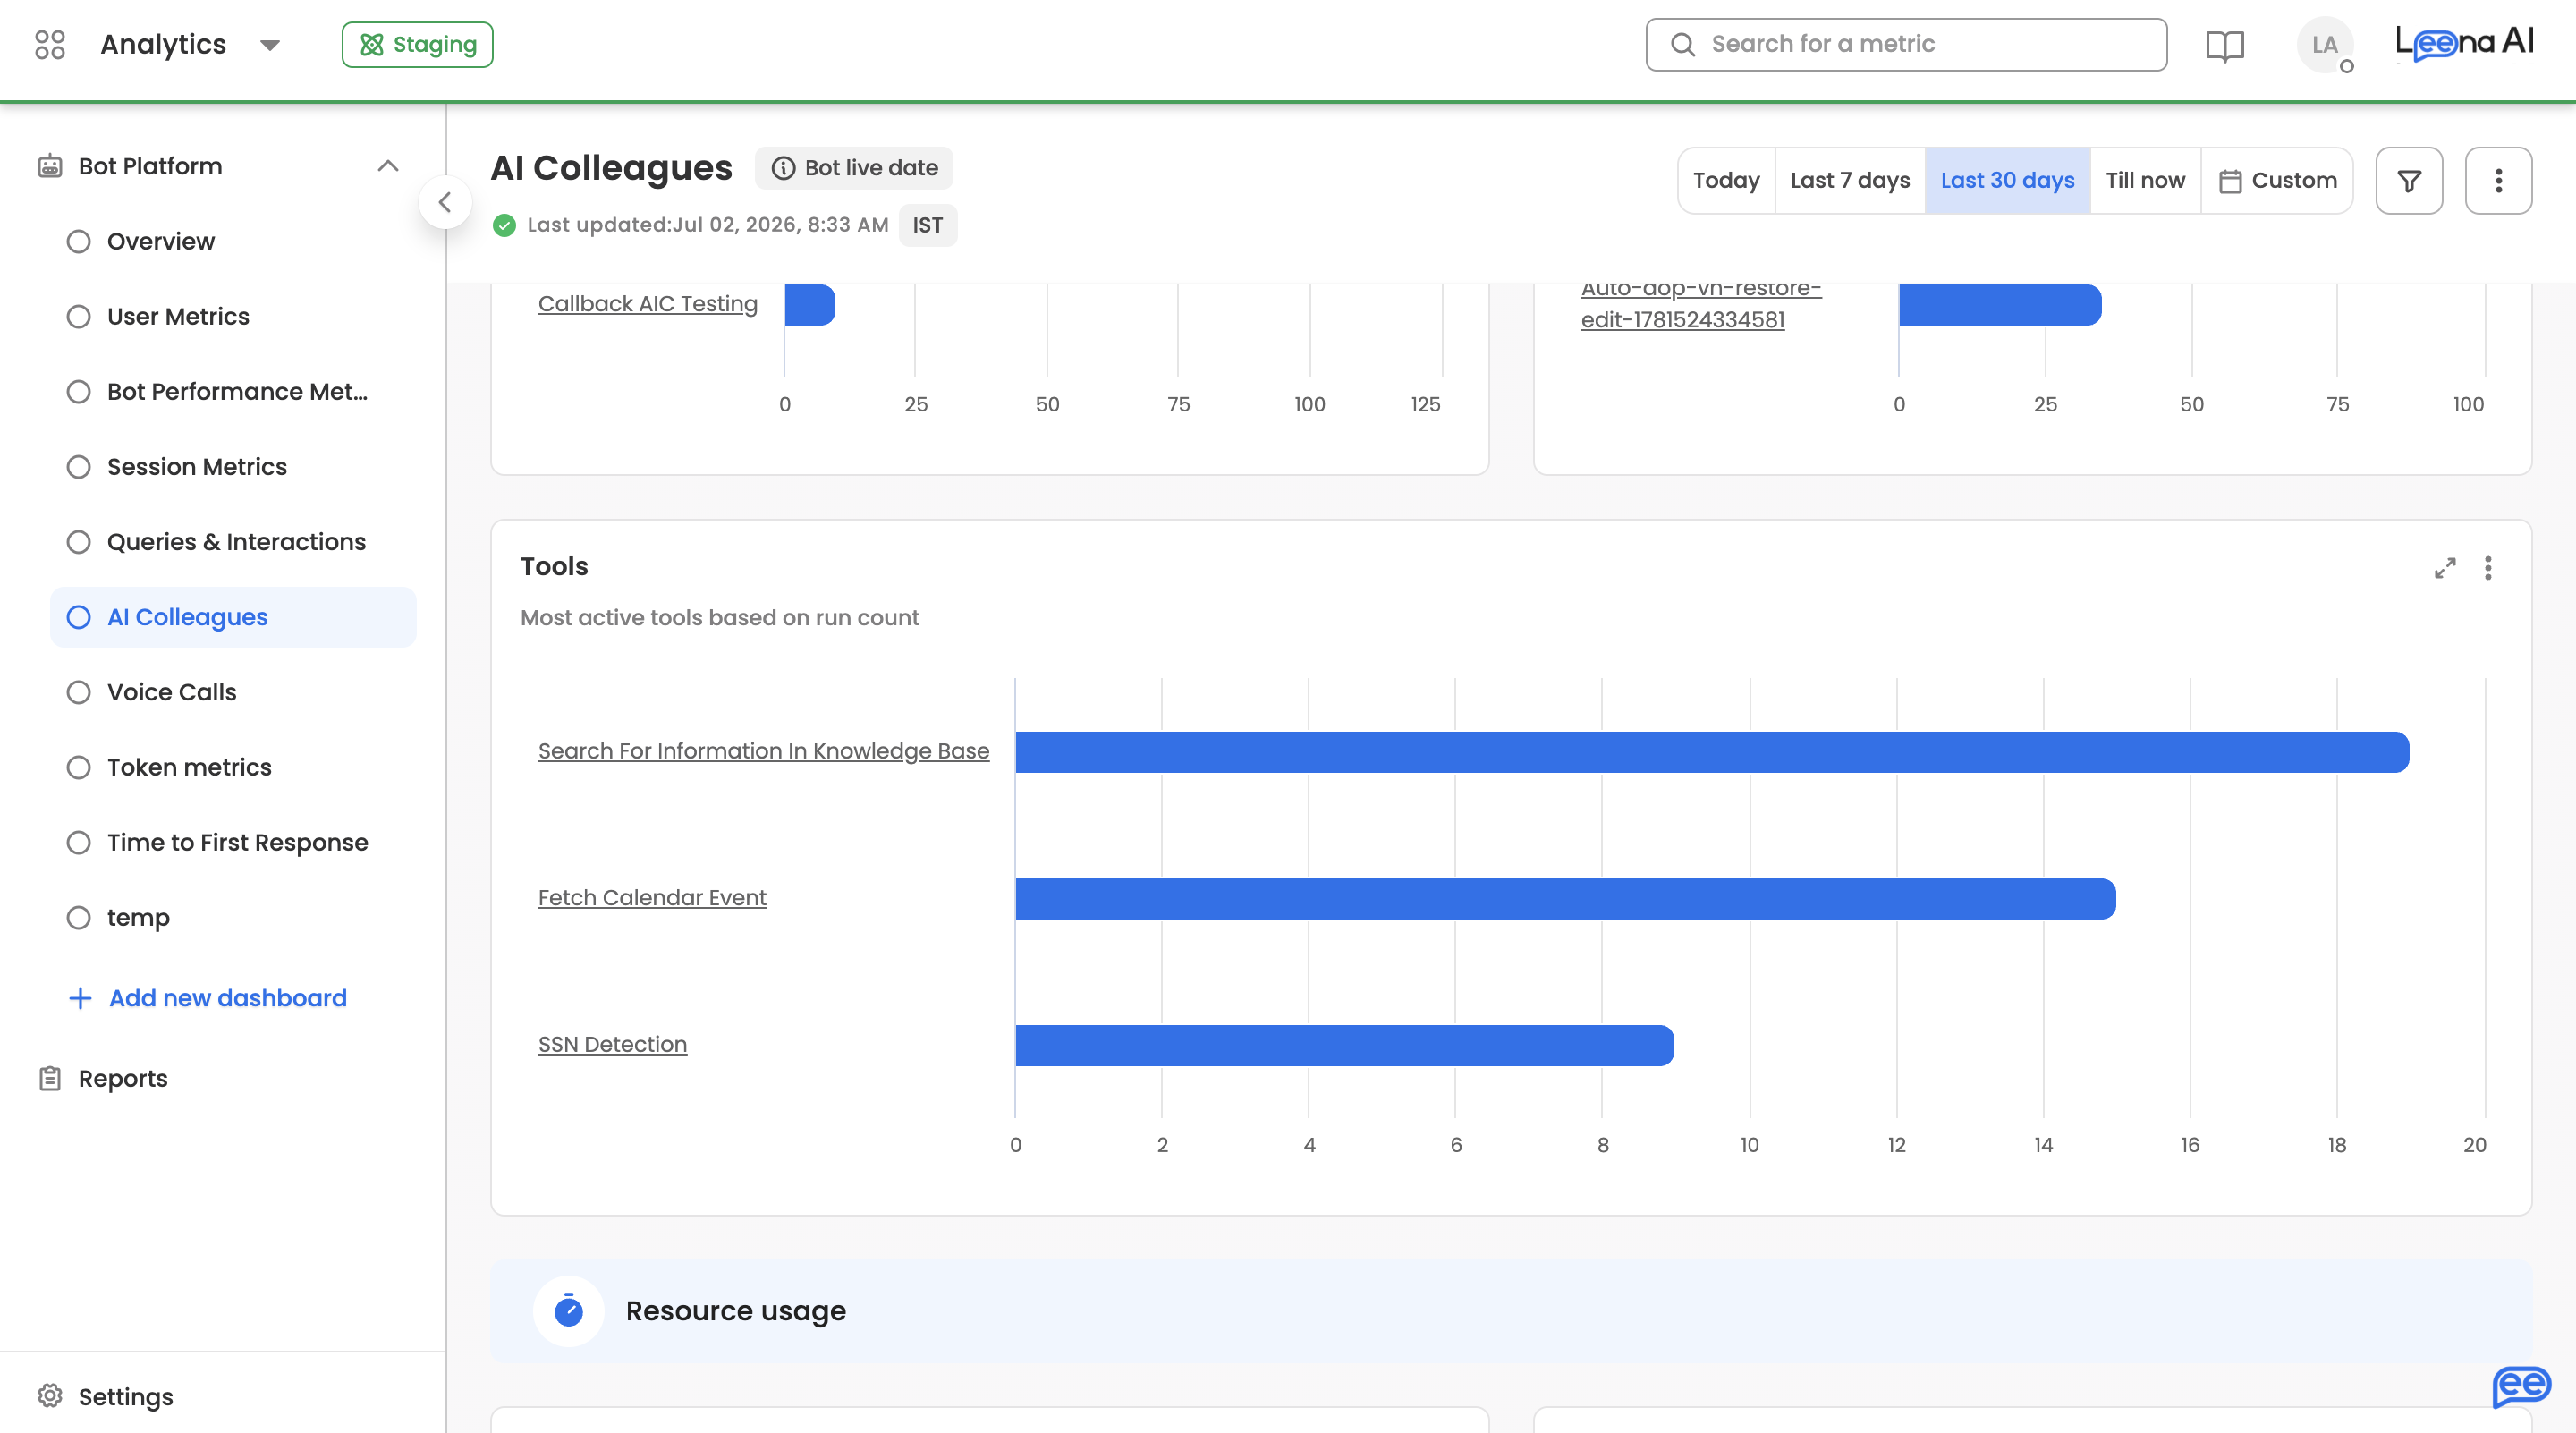
Top performers by run volume
Three leaderboards showing where run volume is concentrated. Click any bar to open the run-level drilldown for that entity.
| Panel | What it shows |
|---|---|
| AI Colleagues | Most active AI Colleagues based on run count |
| AOPs | AOPs handling the highest share of employee requests |
| Tools | Most active Tools based on run count |
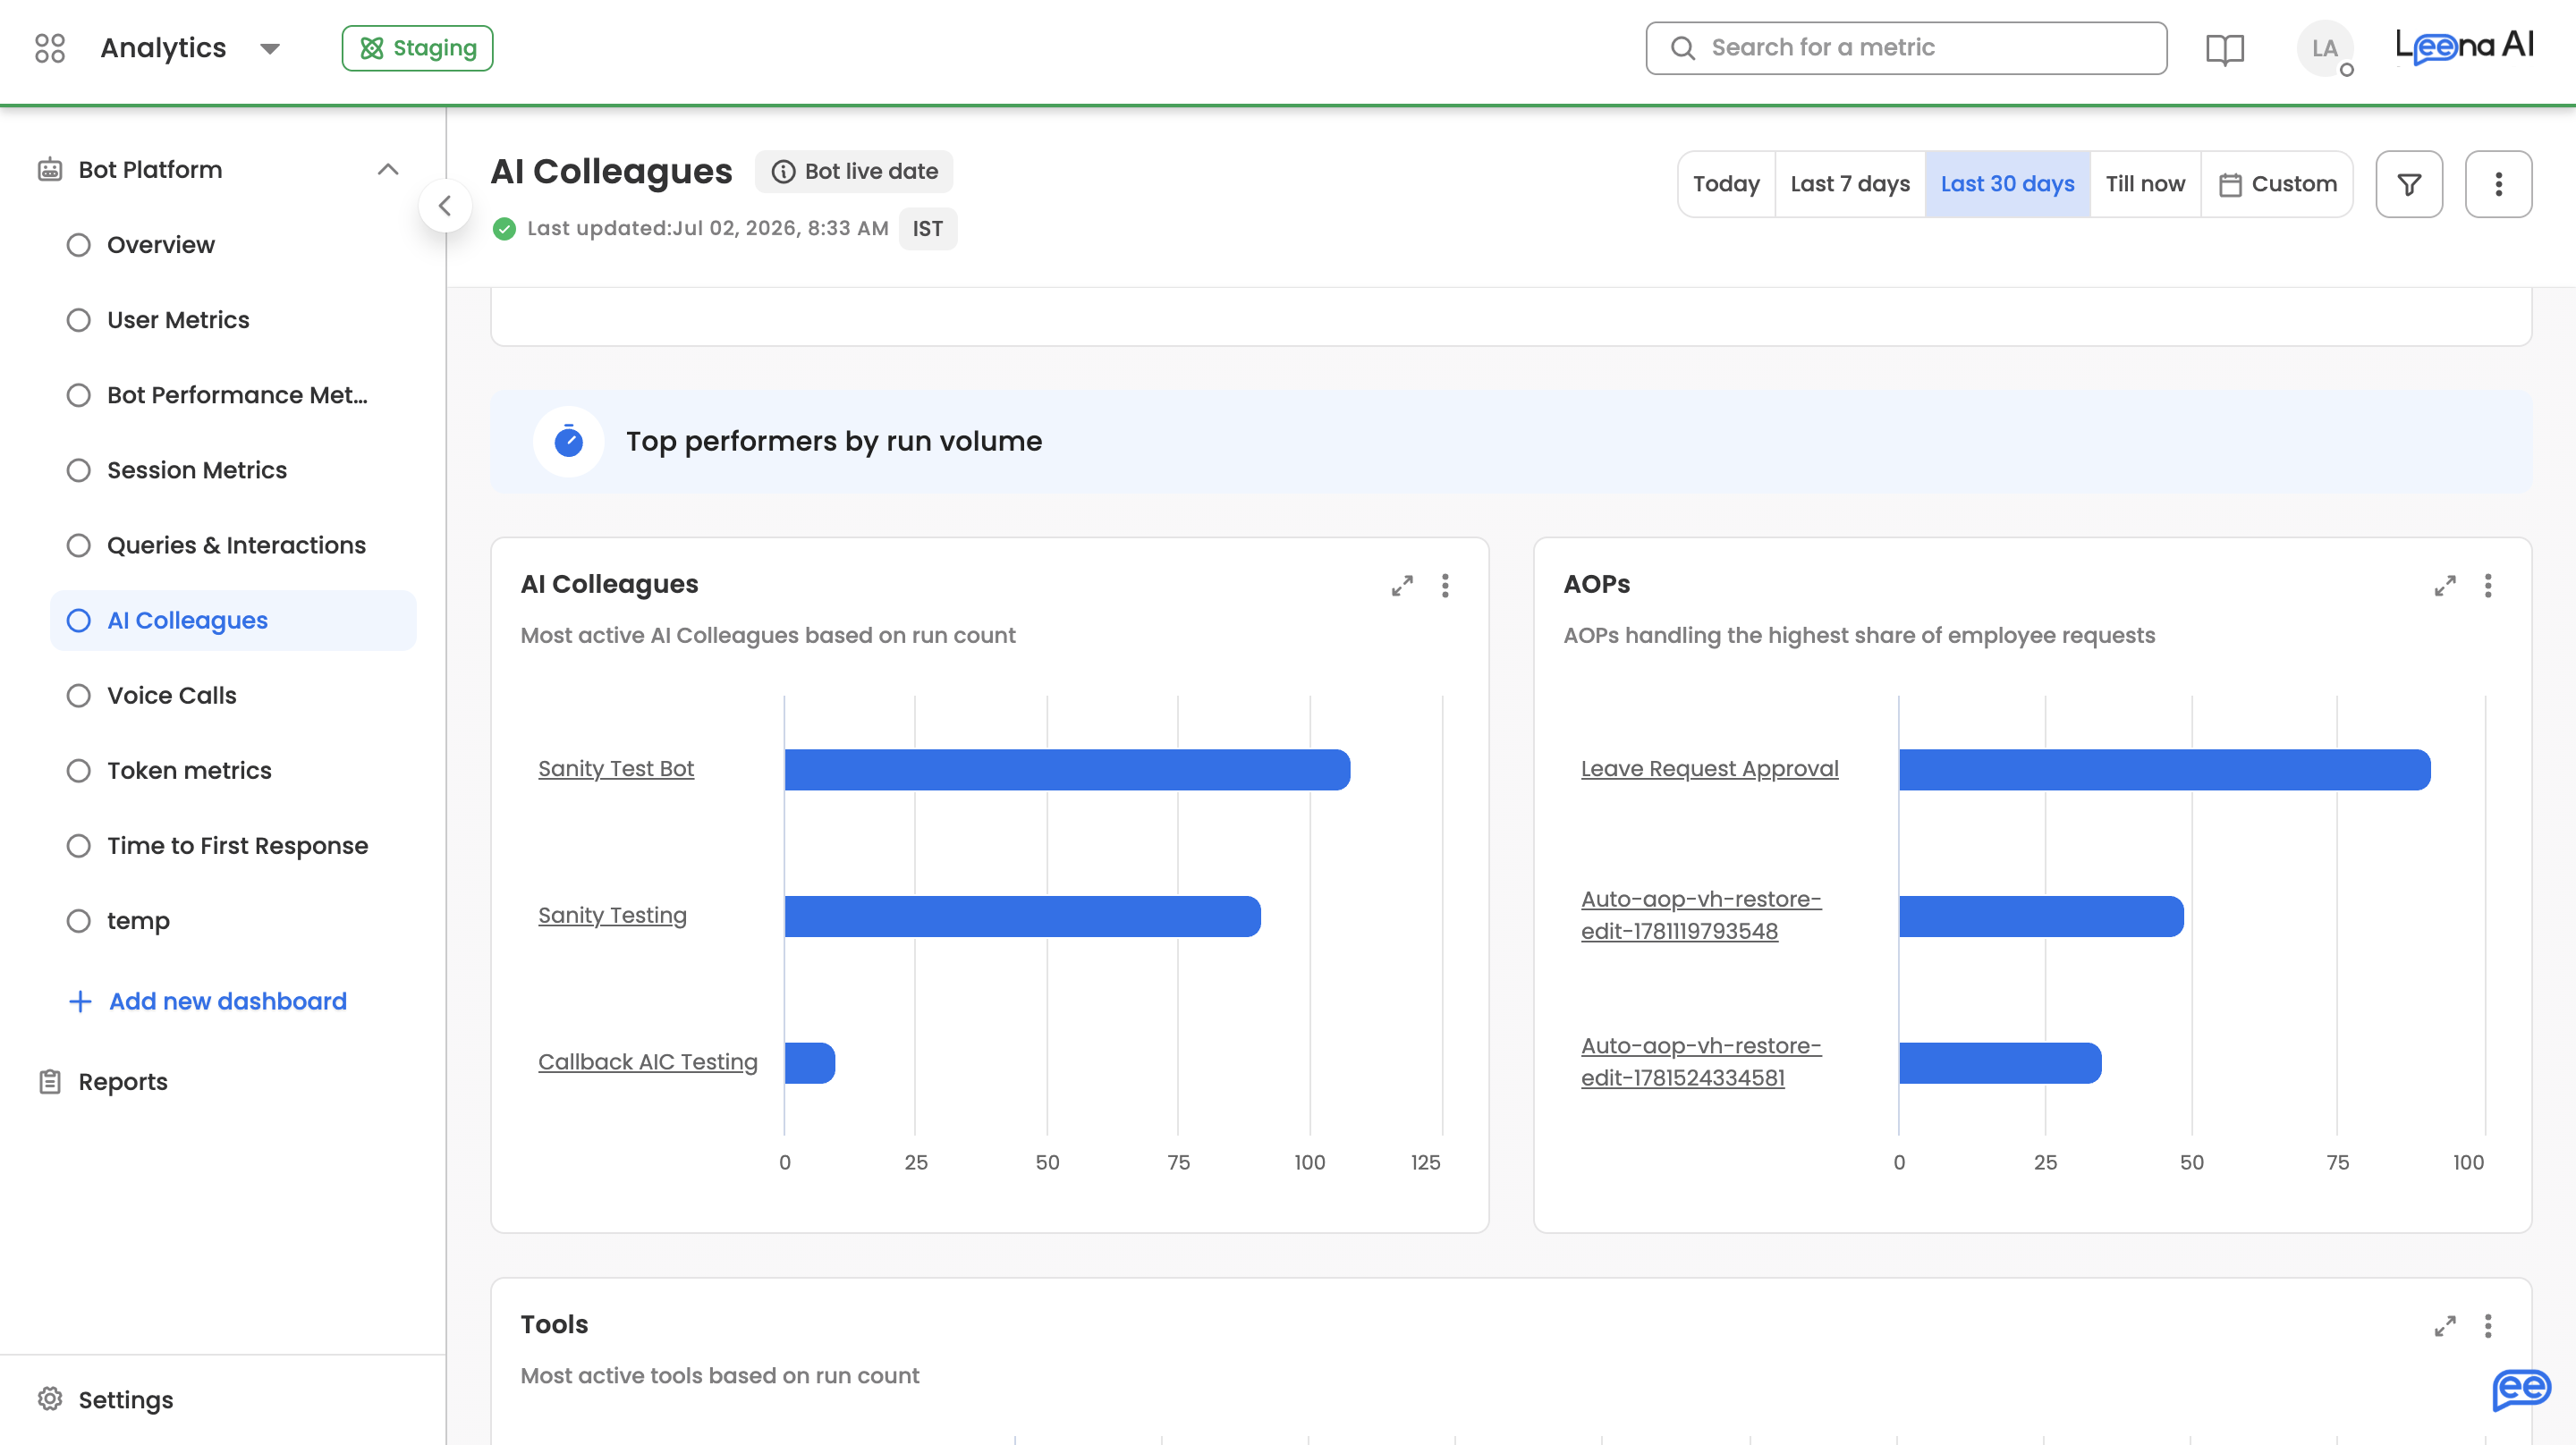
Renamed entitiesLeaderboards and run tables always display the current name of an AI Colleague, AOP, or Tool. If an entity was renamed after a run executed, historical runs are shown under the new name.
Resource usage
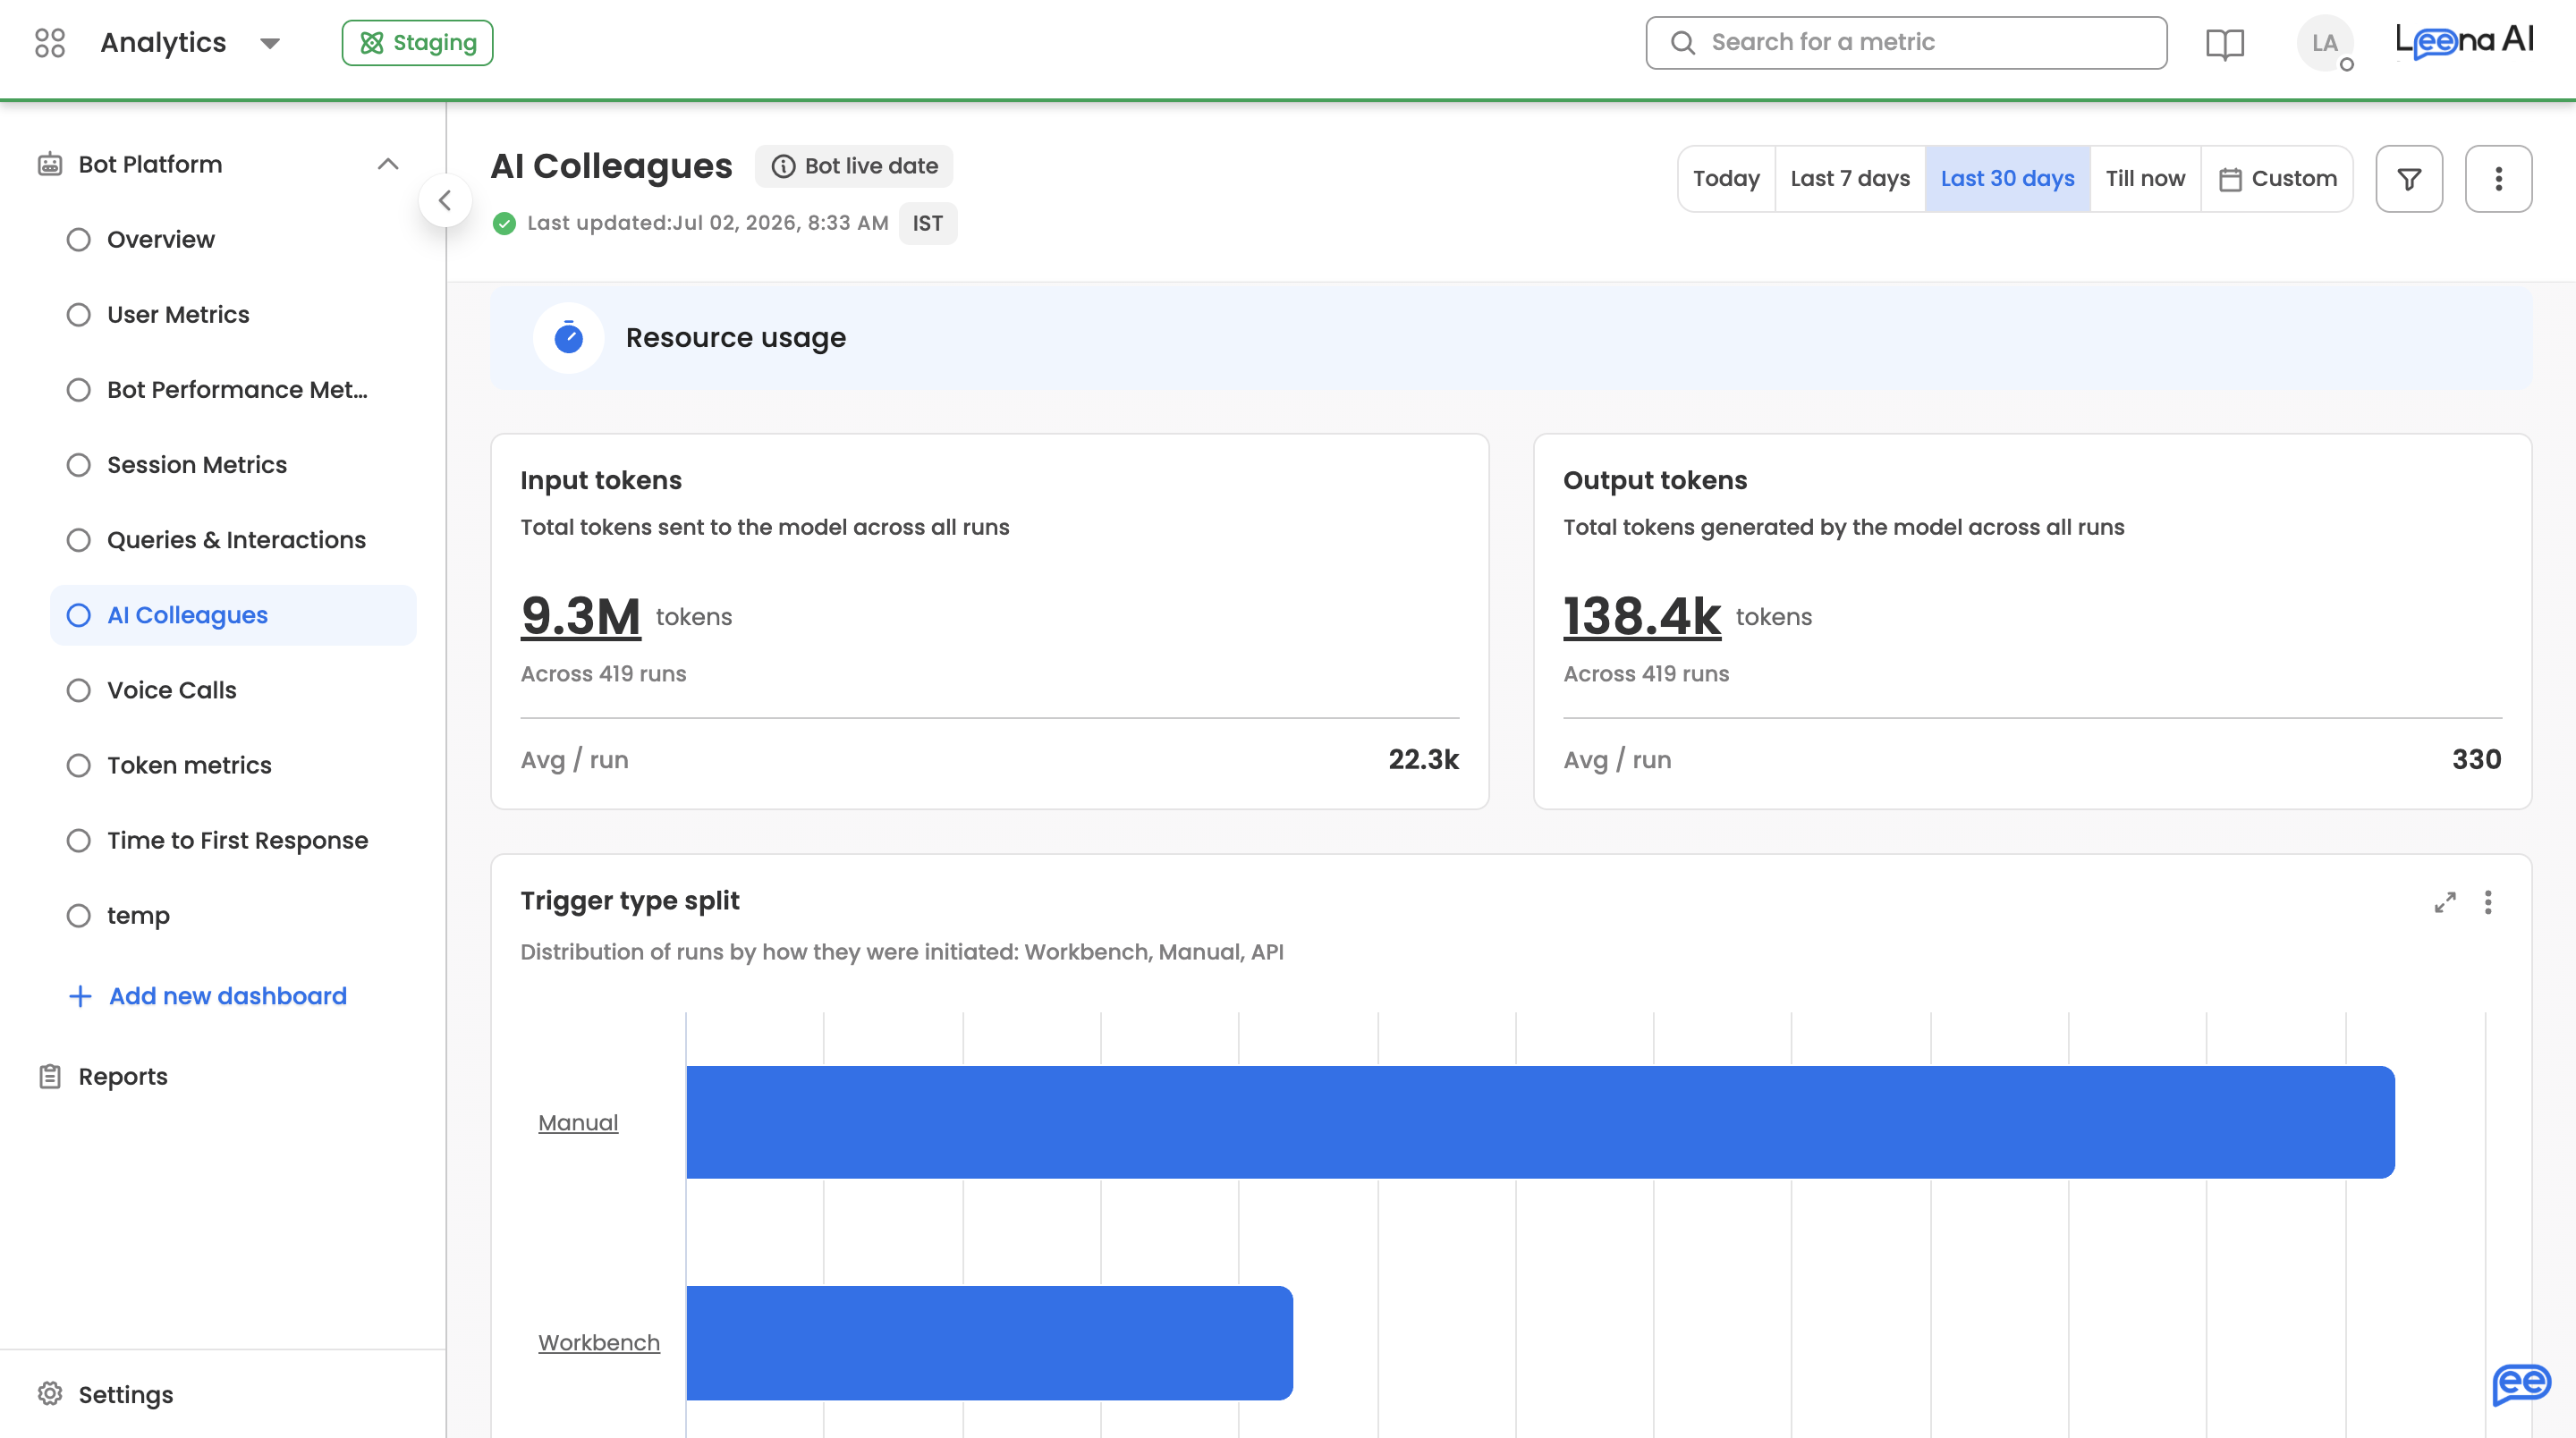
This section tracks LLM consumption and how runs are being initiated.
Input tokens
Total tokens sent to the model across all runs in the period, with the run count ("Across N runs") and an Avg / run figure. Values are abbreviated (k / M) for readability.
Output tokens
Total tokens generated by the model across all runs, with the same run count and Avg / run breakdown.
Trigger type split
Distribution of runs by how they were initiated:
| Trigger type | Meaning |
|---|---|
| Manual | Initiated by an employee via chat or the UI |
| Workbench | Initiated by a schedule configured in the Workbench |
| API | Initiated via a REST API call |
Click a bar to open the run-level drilldown for that trigger type. For Workbench runs, the drilldown includes the name of the schedule that triggered each run.
Run-level drilldowns
Every panel on the dashboard drills down to the same run-level table, pre-filtered to the metric you clicked. Clicking a row takes you directly to that run in the AI Colleague Studio's Run History for full step-by-step inspection.
| Column | Description |
|---|---|
| Run ID | Unique identifier of the run |
| Handled by | The Master Orchestrator or AI Colleague that processed this run |
| Status | Handled, Unhandled, In progress, or Cancelled |
| Initiated on | When the run started |
| Initiated by | Employee who triggered this run |
| Initiated for | Employee on whose behalf the run was executed |
| Trigger type | Manual, Workbench, or API |
| Completed on | When the run reached a terminal status (Handled, Unhandled, or Cancelled) |
| Channel | Communication channel used to initiate the request |
| Schedule name | Name of the schedule that triggered this run (Workbench runs) |
| Escalation | Whether the run required intervention from an escalation contact (Yes / No) |
| Associated Tools | Tools executed by the Master Orchestrator during this run |
| Associated AOPs | AOPs executed by AI Colleagues during this run |
| Total time taken | End-to-end run duration |
| Participants | View list opens a side sheet with everyone involved — initiator, task assignees, escalation manager, and notification recipients |
| Unhandled due to | Category of why the run was not handled (unhandled runs only) |
| Unhandled reason | View reason opens a side sheet with the full explanation |
| Input / Output tokens | Tokens consumed by all LLM calls in this run |
| Guardrail | Count and summary of guardrail violations triggered during the run; click to see violation details |
Drilldown tables support column management, search, sorting, and CSV export. Exports include the participant lists and unhandled reasons as separate columns.
Related Articles
Updated 3 months ago